

New report shows more vacant commercial space in downtown, North Lawrence; one of those big vacancies could be filled soon
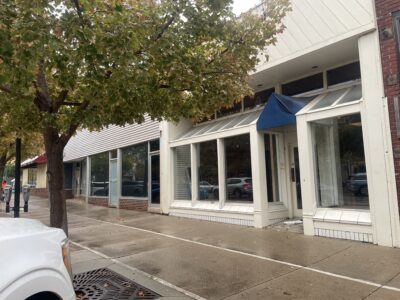
photo by: Sylas May/Journal-World
Vacant storefronts are shown on Monday, Nov. 2, 2026, in the 800 block of Massachusetts Street.
If downtown Lawrence seems to have more vacant storefronts than it did a few years ago – and if North Lawrence seems to have a lot more — some new stats from the City of Lawrence say that really is the case.
But at least in downtown, one of the biggest vacancies recently took a step toward being filled. And there’s reason to believe more activity could soon be happening north of the river, too.
First, let’s look at the vacancy news, which comes from the city’s 2025 retail market report. The city released it a few days ago, and city commissioners are scheduled to receive it at their meeting on Tuesday, though it’s not clear whether they’ll be discussing it in detail.
Whether they talk much about it or not, this report is something the city hasn’t put together since 2018, and it’s full of stats about which types of businesses are locating in which parts of the city, and which areas have the most vacant spaces.
Looking at the city’s biggest retail corridors, the highest vacancy rates in this report are in North Lawrence and downtown, and both are up from the 2018 report. North Lawrence had a 25.5% commercial vacancy rate when the 2025 data was collected, more than three times the amount of vacant space there was in 2018. And downtown had a 17.9% vacancy rate in the 2025 figures, up from 13.6% in 2018.
For comparison, the citywide rate in 2025 was 9.6%, up from 8.1% in 2018, and the city says this figure has been trending slightly upward since 2006, the earliest year this kind of study was conducted.
The report is described as a snapshot of the retail market – this one was in September of 2025 — so it may not be reflective of the year as a whole, and it may have changed since then. It says Lawrence’s retail market’s health “has remained consistent,” and it characterizes the shifts in individual areas of the city as “subtle fluctuations.”
Here’s a closer look at the commercial vacancy rates in Lawrence’s biggest corridors in that 2025 snapshot period:
• North Lawrence: 25.5% vacancy rate — 345,894 total square feet, 88,277 vacant square feet
• Downtown: 17.9% vacancy rate — 1.65 million total, 295,749 vacant
• Sixth Street, from Iowa to Massachusetts: 9.7% vacancy rate — 309,368 total, 29,919 vacant
• South Iowa: 8.6% vacancy rate — 2.33 million total, 200,852 vacant
• 23rd Street: 8.0% vacancy rate — 1.30 million total, 104,362 vacant
• Sixth Street, from Iowa to Wakarusa: 3.4% vacancy rate — 1.54 million total, 51,639 vacant
I’ve chosen to present these stats a bit differently from the ones in the city’s report, because the report separates some corridors into multiple different districts. Specifically, it breaks 23rd Street into two pieces, one east of Massachusetts Street and one between Massachusetts and Iowa; and it breaks Sixth Street into sections east of Iowa, roughly between Iowa and Folks Road, and the commercial center near the intersection of Sixth and Wakarusa.
I think some of these distinctions are more useful than others for visualizing the city’s major commercial areas. It’s pretty clear on Sixth Street, for example, that you’ll find more retail, especially bigger chain stores, west of Iowa than east of it. But on 23rd east and west of Massachusetts, that distinction doesn’t seem as sharp.
You may also have noticed that I haven’t included the area near Sixth and Kansas Highway 10 in these figures. That’s because that area had a lot less activity in September 2025 than it does now. Back then, Lawrence’s new Costco store hadn’t even been announced, and now that it’s open, the city is expecting much more retail and other development there in the coming years.
Here’s a look at how the vacancy rates in the major corridors have changed since 2018’s report:
• 23rd Street: 17.4% in 2018, 8.0% in 2025
• Sixth Street, from Iowa to Massachusetts: 14.1% in 2018, 9.7% in 2025
• Downtown: 13.6% in 2018, 17.9% in 2025
• North Lawrence: 7.6% in 2018, 25.5% in 2025
• South Iowa: 4.6% in 2018, 8.6% in 2025
• Sixth Street, from Iowa to Wakarusa: 3.5% in 2018, 3.4% in 2025
Remember what the report said about fluctuations? While vacancies have gone up in some places, there are also places that have seen a lot fewer vacancies and are balancing things out citywide. Sixth Street east of Iowa had 1 1/2 times as much vacant space in 2018 as it did in 2025, and 23rd Street had more than double the amount of vacant space. There was also one major area, West Sixth Street, that had barely seen any change in its vacancy rate.
Here are a few other takeaways from the report and notes about how Lawrence’s retail economy is faring:
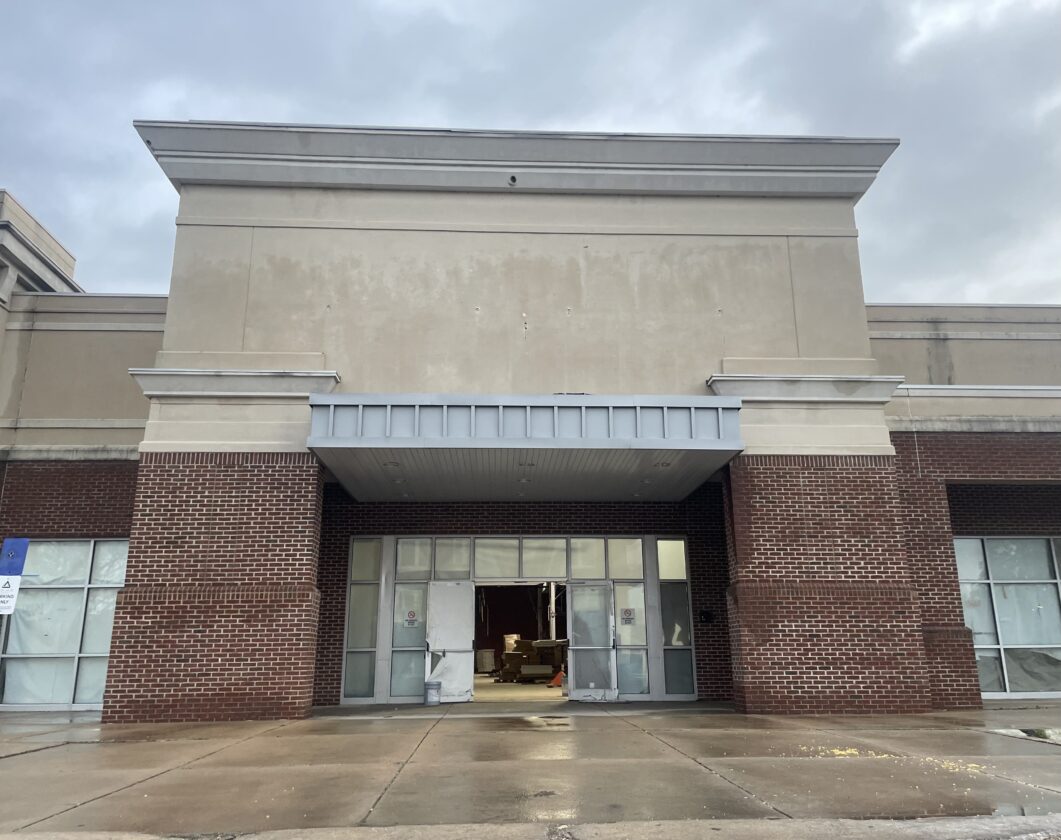
photo by: Sylas May/Journal-World
The vacant former Borders building is pictured on Monday, Nov. 2, 2026, on New Hampshire Street.
Borders and the business center
One of the biggest drivers of downtown’s vacancy rate is the former Borders bookstore site at Seventh and New Hampshire, which has been vacant for 15 years now and is one of the largest vacant properties in downtown.
There’s been some movement this past week on a plan to fill that vacancy – but not with a retailer.
We’ve reported before on a proposal to convert the building into a self-storage facility, and it looks like that will soon come before the Lawrence City Commission for approval. The Planning Commission at its meeting last week voted unanimously to recommend approval of a special use permit for the facility, as long as it meets some conditions to minimize potential changes to the building’s exterior.
The building has been considered for several different projects in the past – a grocery store, an apartment building, a large office space — but idea after idea has fallen through. “Wish we could have come up with something else, probably, but I think this works,” Architect Paul Werner told the Planning Commission last week.
The Borders building was also vacant at the time of the last retail market study, and in the 2025 retail market report, the city says that if Borders and the commercial space within the Riverfront Mall were both occupied, the downtown vacancy rate would fall to 9.7%, much closer to the citywide average.
“As far as uses go, I think this solves the problem,” Werner told the Planning Commission. “Fifteen years is a long time.”
There will surely be more discussion on Riverfront soon, as well, because the city will be taking over the building next spring as part of a lawsuit settlement that it reached with the building’s owners earlier this year.
As for North Lawrence, look for more plans and proposals there, too, because creating more business activity north of the river has been on city officials’ minds lately.
The North Lawrence corridor study is still going on, and it’s identified some areas that could be either opened up for development or redeveloped. One of those underutilized areas is the I-70 Business Center just opposite the turnpike exit, which houses the Department of Motor Vehicles’ driver’s license office and the Journal-World’s offices. Walking past its spaces on Monday, I found four or five that appeared vacant, including one that formerly housed a larger retail business, Family Dollar/Dollar Tree.
Where are the retailers?
One table in the retail market report shows what percentage of the commercial space in each district is occupied by retail specifically, as opposed to other commercial uses such as restaurants or service businesses.
The areas with the highest percentage of their space devoted to retail uses stayed pretty much the same since the last report. South Iowa Street and the intersections of Clinton and Kasold and Sixth and Wakarusa all were around 75% to 80% retail uses in both 2025 and 2018.
But there were a couple of areas that saw more dramatic changes. The share of space devoted to retail uses fell by 31.2% on 23rd Street between Iowa and Massachusetts streets. On Ninth Street, meanwhile, the share of space used by retailers grew by 31.5%.
The pull factor
The report also includes some information from the state about how much retail activity Lawrence brings in from other communities – and that’s something business leaders in Lawrence will probably be keeping a close eye on in the next few years.
The specific measurement in the report is what’s called a “pull factor.” It represents the balance of trade in the area – that is, the difference between what nonresidents are spending in the city, and what Lawrence residents are spending outside of it.
A pull factor that’s greater than 1 means there are more dollars from trade coming into the community than leaving it, and Lawrence has had that positive balance for most of the past 20 years. The only times it dipped below 1 were in 2008, 2009 and 2023, when it was at 0.99.
But there have been years where Lawrence performed better than it did in 2025. Last year’s pull factor was 1.06, and 2024’s was 1.05, but from 2016 to 2019 the pull factor hovered between 1.09 and 1.11.
It will be interesting to monitor this statistic as we get more information about Costco’s sales. This Costco will be the retailer’s closest location to cities farther west like Topeka and Manhattan, and it’s expected to draw in some dollars from outside of the Lawrence area.
A down month for retail
We can’t leave the subject of retail in Lawrence without taking a look at the latest sales tax collection figures here and around the state. The sales tax report for October captures mostly sales made in mid-August through mid-September, and most of the major retail markets we track collected less than they did during the same reporting period last year. Lawrence was near the bottom of the pack; only Kansas City, Kansas, saw its collections shrink more.
• Salina: up 3.1%
• Merriam: up 1.4%
• Overland Park: up 1.4%
• Lenexa: up 1.1%
• Sedgwick County: down 1.4%
• Manhattan: down 2.9%
• Olathe: down 2.9%
• Shawnee: down 3.5%
• Topeka: down 4.5%
• Lawrence: down 6.1%
• Kansas City: down 12.3%
• Statewide: down 1.9%
Year-to-date, Lawrence isn’t too far from where it was in last month’s report. Its sales tax collections still aren’t growing compared to last year’s, which could be problematic for city budget makers, who projected a 1.6% increase for sales and use tax collections in 2026. Most communities in Kansas are seeing their collections grow; Topeka is the only other major retail market we track whose collections are down.
• Lenexa: up 5.2%
• Salina: up 4.8%
• Manhattan: up 4.2%
• Sedgwick County: up 4.1%
• Overland Park: up 3.8%
• Kansas City: up 3.7%
• Merriam: up 2.4%
• Shawnee: up 2.3%
• Olathe: up 2.1%
• Lawrence: down 0.1%
• Topeka: down 0.4%
• Statewide: up 2.4%
Town Talk column
New report shows more vacant commercial space in downtown, North Lawrence; one of those big vacancies could be filled soon
National Weather Service move to Lawrence ramping up; developer Phil Bundy still pursuing a STAR bond project and more news and notes
A former lieutenant governor and his granddaughter fell in love with this Lawrence bar, and now they’re helping preserve it
Lawrence City Commission to weigh whether Costco should be included in STAR bond district
Thanks to a nonprofit that pairs artists and landlords, the Lawrence Potters’ Guild gets a temporary space of its own
