From home sales to sales taxes to job totals, here’s a look at how Lawrence’s economy is faring in 2023

photo by: John English
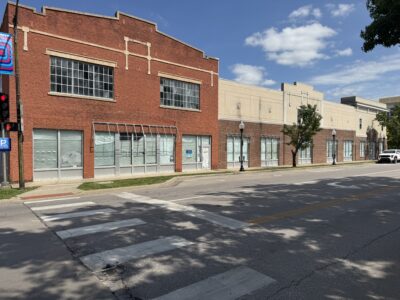
This aerial photo taken on June 12, 2022, shows Lawrence with the University of Kansas campus in the background.
A quarter of the year is gone, and the numbers are piling up. Here’s a quick look at three sets of numbers — in housing, sales taxes and jobs — that provide a glimpse at how the Lawrence economy is doing thus far in 2023.
•••
Mark the month of March as a potential turning point in Lawrence’s housing market. The latest numbers from the Lawrence Board of Realtors show that not only did home sales fall during the month, but so did average selling prices.
Those falling home prices are a new development. Home sales numbers have been falling in Lawrence for months, as the market has had a dearth of inventory. But despite the falling sales, home prices had continued to rise.
In March, though, the median selling price dropped by 3.2%. The average home sold for about $273,000 in March, down from about $282,000 in March 2022. One month does not make a trend, but this is how trends start.
As for the number of homes being sold, we certainly are in a downward trend in that department. Home sales dropped by 6.8% in March, compared with the same month a year ago. Sixty-nine homes sold during March.
The more striking number is the year-to-date totals. With a quarter of the year in the books, home sales are down 25% from the same period a year ago. Look for that trend to continue. Early indications are that home sales numbers also will fall in April, which historically is one of the more important months in the real estate calendar.
The monthly report from the Lawrence Board of Realtors shows contracts written in March — which usually are converted to sales in April — are down 43% from a year ago.
The latest numbers also give some reason to believe the trend in declining prices might continue. While home sales numbers are falling, the number of homes on the market is increasing. March ended with 100 active listings on the market. That’s a 25% increase from a year ago.
What the monthly report, however, doesn’t much reflect is the impact mortgage rates may have on the market in the months ahead. Interest rates on 30-year mortgages peaked in November at a little more than 7%. They have since fallen, and currently are in a five-week decline. If that trend continues, buying activity may pick back up, and the remaining three quarters of this year may look quite different from the first quarter.
Finally, it also is worth remembering that even though the Lawrence market has shown some signs of softening, it definitely is still a seller’s market. Perhaps the number most indicative of that trend is the number of days a home sits on the market before selling: The median in Lawrence thus far in 2023 is seven days. That’s an improvement over last year’s median of four days, but it is still a sign of a very tight market tilted toward sellers.
•••
A slowdown of sorts also has occurred on the retail front in Lawrence. But it is not yet a worrisome one.
The slowdown is not that Lawrence shoppers are spending less. That would be hard to do in these inflationary times. Rather, the rate that Lawrence’s sales tax collections is growing has slowed a bit. Through the first three months of the year, Lawrence’s sales tax collections are up 7.5%, compared with the same period a year ago. For all of 2022, Lawrence sales tax collections grew by 8%. For all of 2021, sales tax collections in the city were up 9.1%.
So, our growth rate is in a multiyear slowdown. But, it is worth remembering that sales tax collections are still growing, just not as fast as they once were. And, it is really worth remembering that these growth rates are still historically high.
The 2021 growth rate of 9.1% is believed to be the highest in the city’s history. The 8% mark the following year is believed to be the second highest in history. The 7.5% rate that the city has posted thus far is still far better than the 3% to 5% that Lawrence normally posts.
Of course, there is still a lot of year left for these numbers to change. Sales tax collections can vary widely from month to month. In fact, the March numbers showed Lawrence’s collections were up 11.7% compared with the same one-month period a year ago. While those figures go in the books as March collections, they really represent sales made primarily in January. That’s because there is a lag time from when retailers collect the sales taxes from shoppers and when the state receives them and distributes them to cities and counties.
So, technically, these March numbers were the first glimpse we got of the shoppers’ mood in 2023. If their spirits remain this high, Lawrence’s sales tax collections are going to grow by quite a bit this year.
But it is never wise to put too much stock in one month’s worth of sales tax collections. However, multiple months of data can show some trends. Below shows how Lawrence is faring through the first quarter of this year, compared with the state’s other large retail markets.
• Manhattan: up 18.6%
• Lenexa: up 9.5%
• Sedgwick County: up 8.2%
• Kansas City: up 9.3%
• Lawrence: up 7.5%
• Topeka: up 7.4%
• Olathe: up 6.2%
• Salina: up 6.0%
• Shawnee: up 5.3%
• Overland Park: up 5.2%
• Statewide: up 8.3%
•••
The numbers on jobs may be the most clear-cut positive numbers in the Lawrence economy thus far in 2023. However, they also are the numbers we have the least of. Monthly job totals from the state are slow to develop, so we only have job totals through February.
But those show the number of jobs in Lawrence and Douglas County are on the upswing.
February ended with 55,400 jobs inside Douglas County, according to the latest figures from the Kansas Department of Labor. That’s an increase of 4.7% — or about 2,500 jobs — from February 2022 numbers. That growth rate is better than the state as a whole, which grew jobs at a 3.1% rate.
Almost every category of jobs grew in the year, but the leisure and hospitality industries posted the biggest gains. They’ve added 900 jobs for a nearly 13% growth rate in the last year. Retail jobs were the only category to post a decline. They dropped by less than 2%, or a loss of about 100 jobs.
A key job category for Lawrence is government jobs, since that is how many of KU’s employees are classified. That category basically held steady over the last year. That is a victory considering those numbers have been declining in recent years as KU has implemented job cuts. For the year, Douglas County posted a 0.6% increase in government jobs.
It will be interesting to see whether Lawrence starts to see a bigger rebound in that sector at some point. Some communities are starting to see more significant growth in government jobs. The Manhattan and Wichita metros both have posted increases of about 3% in government jobs for the year, while the KC metro grew by a little more than 2%.
Another key job measurement is how many people who live in Douglas County are working somewhere. (The numbers above measure only how many jobs are inside the county and don’t factor in where the people who have the jobs live.)
Numbers from the Bureau of Labor Statistics show that in February nearly 67,000 Douglas County residents had a job in the county or elsewhere. Importantly, that puts the number of people employed in the county above levels in 2019, which was prior to the pandemic. In February 2019, about 65,000 Douglas County residents were employed.
Town Talk column
Plan for large annexation west of SLT shrinks by more than 300 acres; less land set aside for housing
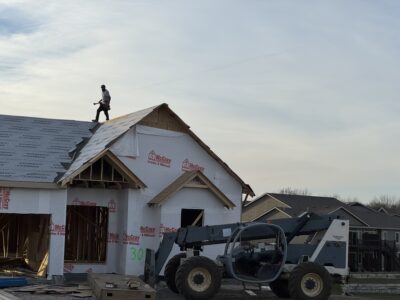
With half the year done, Lawrence again on pace to set record low for single family home construction
Kansas City development company seeking to build $100M worth of housing at KU’s West Campus district

Lawrence home sales down for the year, despite an uptick in number of homes for sale

K.C. company plans to start program for Lawrence residents to recycle food waste, create area compost facility