2020 Census numbers show white population in Douglas County declined over the last decade
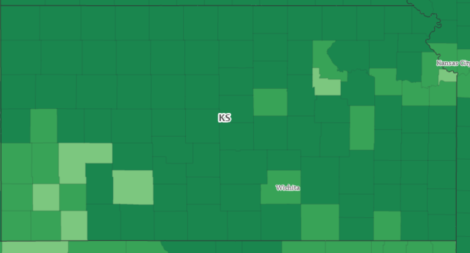
photo by: Courtesy: U.S. Census Bureau
The map above shows Kansas population based on percentage of residents who identify as white. The darker the green on the map the larger percentage of a county's population that identifies as white, according to the new numbers from the 2020 Census.
Douglas County’s population of white residents dropped by about 1% in the last decade, while nearly every other racial category saw growth, according to new 2020 Census data.
The number of white Douglas County residents dropped by nearly 1,000 people since 2010, and as a result the percent of county residents who identify as white fell below the 80% level, likely for the first time in the county’s history.
People who identify with two or more racial groups comprised the fastest growing population segment in the county since 2010. The number of people claiming two or more races grew by nearly 6,400 residents.
The numbers in Douglas County are similar to those being posted across the country. The 2020 Census marked the first time that the white population in the U.S. fell.
Here’s a look at Douglas County’s population breakdown by race. This chart shows the total percentage for each racial group, compared with its percentage in the 2010 Census.
• White alone: 78% versus 86.5% in 2010.
• Black alone: 4.5% versus 3.9% in 2010.
• American Indian alone: 2.5% versus 2.6% in 2010.
• Asian alone: 3.9% versus 3.7% in 2010.
• Pacific Islander alone: 0.07% versus 0.05% in 2010.
• Some other race: 2.2% versus 1.3% in 2010.
• Two or more races: 8.8%, versus 3.7% in 2010.
Here’s a look at the same breakdown except by actual population totals:
• White alone: 92,694 people, down 973.
• Black alone: 5,301 people, up 944.
• American Indian alone: 2,950 people, down one person.
• Asian alone: 4,685 people, up 539 people.
• Pacific Islander alone: 86 people, up 21 people.
• Some other race: 2,569 people, up 1,080 people.
• Two or more races: 10,500 people, up 6,349 people.
With those numbers you can calculate some growth rates. For example, the white population saw about a 1% decline in its numbers, while the segment of the population that identifies with two or more races surged by about 250%. Other big movers of note included a growth rate of 21% for the Black population, and a 72% growth rate for people who identify with a race not listed.
The latest Census numbers also show that the Hispanic population — which is considered an ethnic category, not a race category — also grew. The Hispanic population now represents 7% of the county’s population, up from 5% in 2010. By the numbers, there are 8,295 Hispanic residents in the county, an increase of 2,644 people.
But don’t let Douglas County’s growth in minority populations lead you to believe that the county is a hotbed for racial diversity. The latest Census numbers continue to show that Douglas County’s population is more predominantly white than the state’s population as a whole. In other words, white residents make up 78% of Douglas County’s population, while they make up 75.6% of the state’s population.
The only racial categories where Douglas County has a greater percentage than the state as a whole are Native Americans and Asians. The same holds true for the Hispanic population. While the Hispanic population in Douglas County had a strong growth rate of 46% for the decade, you are far more likely to see Hispanics make up a larger percentage of a community in many other places in Kansas. The Hispanic population in Kansas totals 13% of the state’s population compared with 7% in Douglas County.
Four counties in the state now have a majority Hispanic population — Ford, Finney, Grant and Seward County, which all are in the southwest part of the state and have a large meatpacking industry. Seward tops the state with 65% of its population as Hispanic. In eastern Kansas, Wyandotte and Lyon counties — home to Kansas City and Emporia, respectively — have the highest concentration of Hispanics, according to the Census data.
On the racial front, the white population is in the minority in only two of Kansas’ 105 counties: Seward and Wyandotte.
Here’s a look at the state of Kansas’ population breakdown via race and Hispanic origin. The chart shows 2020 Census numbers versus 2010 Census totals.
• White alone: 75.6% versus 83.8%.
• Black alone: 5.7% versus 5.8%.
• American Indian alone: 1.1% versus 0.9%.
• Asian alone: 2.9% versus 2.3%.
• Pacific Islander: 0.1% versus 0.07%.
• Some other race: 4.9% versus 3.8%.
• Two or more races: 9.5% versus 3.0%.
• Hispanic: 13% versus 10.5%.
Correction: This article was corrected to fix a math error. The population of white residents declined in Douglas County by about 1% during the last decade.
Town Talk column
Plan for large annexation west of SLT shrinks by more than 300 acres; less land set aside for housing
With half the year done, Lawrence again on pace to set record low for single family home construction
Kansas City development company seeking to build $100M worth of housing at KU’s West Campus district

Lawrence home sales down for the year, despite an uptick in number of homes for sale

K.C. company plans to start program for Lawrence residents to recycle food waste, create area compost facility