

Transit sales tax election was Lawrence’s closest in 2026, and without KU and downtown, it could have been much closer
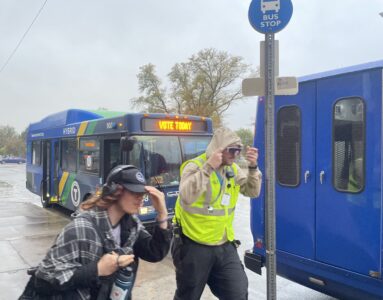
photo by: Sylas May/Journal-World
A sign on a Lawrence Transit bus reminds people to vote on Election Day, Tuesday, Nov. 3, 2026, in the 700 block of Vermont Street.
The closest race in Lawrence on Tuesday wasn’t for a statewide office, or for a seat in the Statehouse or on the County Commission.
Instead, it was a vote on something that Lawrencians had approved in a 70% landslide in two previous elections – the city’s transit sales tax. And, if not for voters near KU and downtown, it could have been a whole lot closer.
We reported on Election Night that voters split 56% yes and 44% no on the tax question, which asked whether to raise the transit sales tax from 0.2% to 0.3% next spring and extend it for 10 years. Lawrence Transit depends on the tax to fund its operations, and it wanted the increase to help it navigate rising expenses, an expected drop in federal funding and a new contract with its service provider that’s coming up in 2029.
This is the third time voters have weighed in on the tax, and this election was by far the closest. First, voters approved the creation of the 0.2% tax by a 70-30 margin in 2008. Then, in 2017, they approved a 10-year extension by roughly the same margin.
Before we get too deep into this year’s numbers, it’s important to note that nowhere in Lawrence really rejected the sales tax increase. There wasn’t one single precinct that had less than 50% support for the question, so, even if you picked a random precinct in the Lawrence city limits and made only its votes count, the tax increase still would have a 100% chance of passing.
But it was a much closer contest in some places than in others.
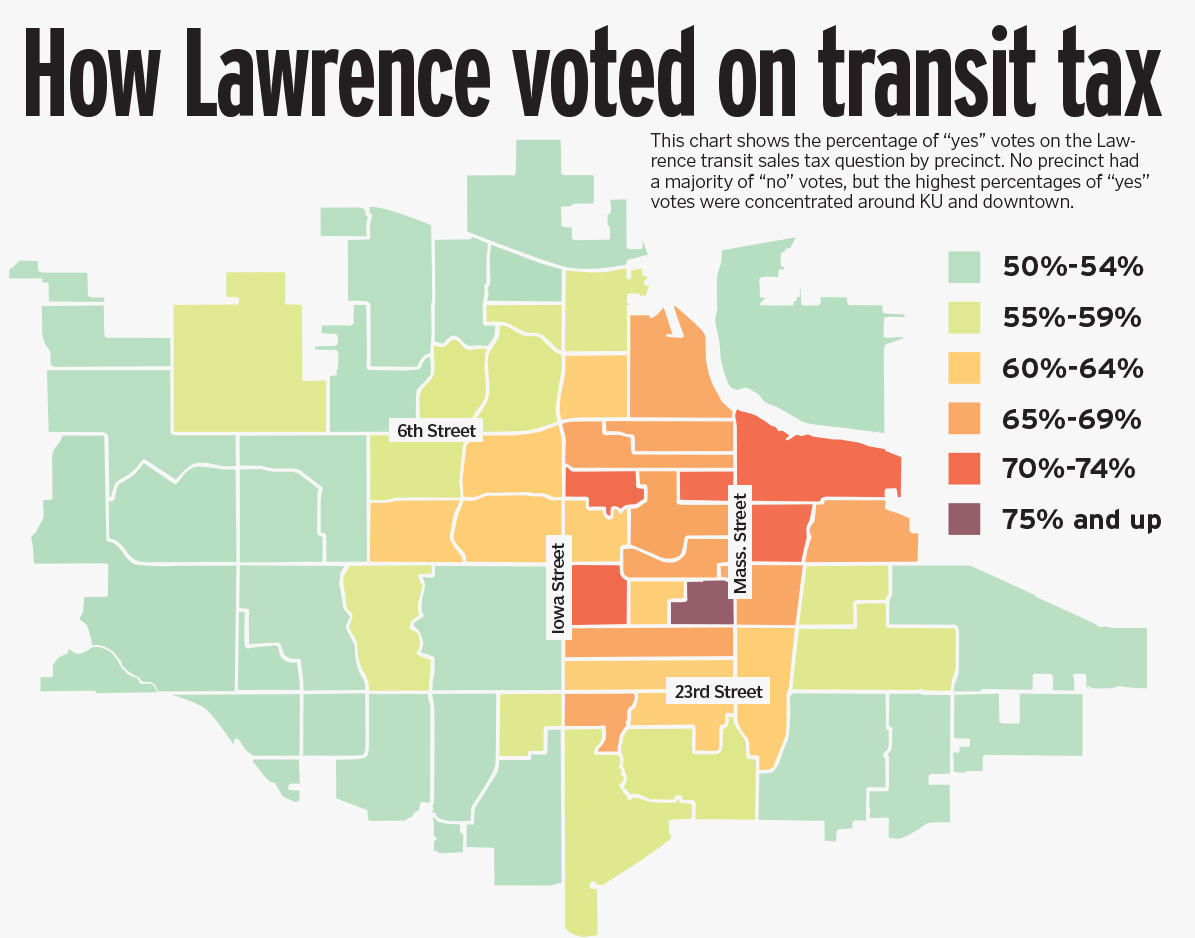
Of the 62 precinct divisions listed on the Douglas County Elections Office’s unofficial results, 37 of them had a “yes” vote of less than 60%; only six had 70% or more who supported raising and extending the tax.
The precincts with the greatest support were those near the University of Kansas campus and in the downtown area. All of the precincts with a “yes” vote of 70% or more were at KU, in downtown or right next to either of those. One of them was the precinct that contains the dorms on Daisy Hill; another one, in the neighborhood just southeast of campus, had the highest percentage of “yes” votes anywhere in the city at 75.1%.
On the edges of Lawrence, however, some precincts were split nearly 50-50. In one precinct in the city’s southeast corner, the difference between the supporters and opponents was only two votes. In three other precincts in the same area, the differences were three, five, and seven votes, respectively.
There was also an east-west split: Only three precincts west of Iowa Street had greater than 60% support for the sales tax question, and two of those border Iowa Street. (One of them is right across the street from Central Station, the city’s main bus hub at 2315 Bob Billings Parkway.)
These numbers definitely show a pattern, but what does that pattern mean? It’s hard to say, because this vote wasn’t just a referendum on the transit system itself.
This vote was primarily about whether to increase the sales tax, so those who voted against it might be people who like the transit system in Lawrence, but think it needs some cuts or a different funding source.
If this vote had failed, the city had planned to try again next year, asking voters to keep the tax at its current level of 0.2% and extend it for 10 years. A 56-44 split on that question might have sent a different message, because a “no” vote would be a vote to let the tax sunset. That might have been an indicator that many people in Lawrence wanted a much smaller public transit system — or no public transit system at all, because the city has said that without any sales tax, Lawrence Transit wouldn’t be able to operate.
It could also be that the bus system is just much more visible and on people’s minds in the areas with the most support. Many KU students on Daisy Hill take the bus to their classes every day, and all of the city’s bus routes stop at either Central Station near campus or in downtown. But only three of the city’s 21 routes go farther west than Kasold Drive, and only three reach the southeast corner of the city.
Here are a few more tidbits from this year’s election stats:
Nothing else in Lawrence was close
Apart from the sales tax vote, the other races in Lawrence were extremely lopsided. Many of them, such as the races for state House seats, had only one candidate on the ballot, a Democrat. The three County Commission winners each had more than three-quarters of the vote. And the statewide races looked much the same.
You can see countywide and precinct-by-precinct results on the Douglas County Elections Office website, but they don’t give you the whole picture of just how dominant Democrats were in Lawrence. To give you a better idea, I’ve calculated how candidates for three major statewide races performed just within the Lawrence city limits.
• Governor: Democrat Cindy Holscher 82.7%, Republican Ty Masterson 17.3%.
• Attorney general: Democrat Chris Mann 83.8%, Republican Kris Kobach 16.2%.
• U.S. Senate: Democrat Adam Hamilton 82.7%, Republican Roger Marshall 15.5%, Libertarian David Graham 1.8%.
But it’s also easy to forget just how different things look outside of Lawrence. Below is how the same races played out in Douglas County precincts outside of the Lawrence city limits. That includes the county’s three other cities, Lecompton, Eudora and Baldwin City, and the unincorporated areas.
• Governor: Democrat Cindy Holscher 53.7%, Republican Ty Masterson 46.3%.
• Attorney general: Democrat Chris Mann 55.1%, Republican Kris Kobach 44.9%.
• U.S. Senate: Democrat Adam Hamilton 54.3%, Republican Roger Marshall 42.3%, Libertarian David Graham 3.4%.
Marshall’s support was even lower than before
Douglas County didn’t go for Marshall when he was elected to the U.S. Senate in 2020, either, but he actually lost some of the support he did have here between then and now.
In 2020, 16,594 Douglas County voters, or 27.9%, went for Marshall, and 40,262, or 67.7%, voted for his Democratic opponent, Barbara Bollier. This year, Marshall lost nearly 6,000 of the votes he previously had in Douglas County. He had 10,768 votes, or 21.6%, and his Democratic opponent, Hamilton, had 38,009, or 76.2%.
Turnout compared to past midterms
Voter turnout in Douglas County was at 61.4% this year, which is pretty much in line with other recent midterms. The last midterm election, 2022, had about 58% turnout in Douglas County, and the one before that, 2018, was actually higher than this year’s at 62.3%
If you’re just going by number of votes cast, however, 2026 was the biggest midterm in the county in at least the last 20 years.
Here’s a list of turnout numbers and percentages for even-year elections over the past 20 years. Midterm elections are in bold.
• 2026: 50,104; 61.4%
• 2024: 59,054; 71.0%
• 2022: 47,561; 57.9%
• 2020: 60,150; 73.0%
• 2018: 49,772; 62.3%
• 2016: 51,450; 63.3%
• 2014: 38,246; 50.3%
• 2012: 48,613; 61.8%
• 2010: 33,516; 42.0%
• 2008: 53,798; 64.7%
• 2006: 35,070; 45.7%
Town Talk column
Transit sales tax election was Lawrence’s closest in 2026, and without KU and downtown, it could have been much closer
New report shows more vacant commercial space in downtown, North Lawrence; one of those big vacancies could be filled soon
National Weather Service move to Lawrence ramping up; developer Phil Bundy still pursuing a STAR bond project and more news and notes
A former lieutenant governor and his granddaughter fell in love with this Lawrence bar, and now they’re helping preserve it
Lawrence City Commission to weigh whether Costco should be included in STAR bond district