Numbers of interest about the Lawrence Police Department from the 2019 Benchmark Cities Survey

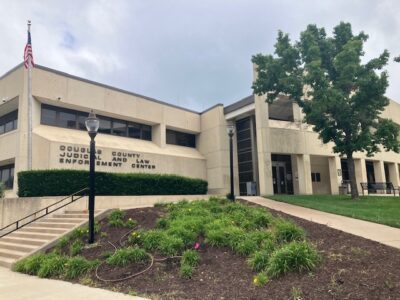
photo by: Journal-World File Photo
In this file photo from Aug. 4, 2020, a Lawrence Police Department patrol vehicle is pictured outside the Douglas County Judicial and Law Enforcement Center.
The Lawrence Police Department serves one of the smaller “benchmark cities” in an annual report produced by the Overland Park Police Department, but it has one of the highest percentages of female officers, the report shows.
The annual Benchmark Cities Survey, produced by staff of the Overland Park Police Department, compiles statistics from 29 cities across the country. It’s intended to allow departments to compare and contrast their performance in order to help set better goals and objectives, according to the report.
The cities range in size from 24 square miles (Coral Springs, Fla.) to 353 (Chesapeake, Va.), with a median size of 66.7 square miles. Populations range from 96,392 in Edmond, Okla., to 321,781 in Henderson, Nev., with a median of 147,841. Of the 29 cities, 17 have brick-and-mortar, dorm-based universities; 11 of them, Lawrence included, also have university police departments.
Lawrence falls on the smaller end in terms of size, at 34.9 square miles, and in terms of population, at 102,980, according to the survey.
Here are some numbers of interest from the latest survey for the Lawrence Police Department. In parentheses after most entries is the city with the highest number for that category, followed by the city with the lowest. All of these numbers are taken from the 2019 Benchmark Cities Survey.
Staffing, budget and training
• From 2017 to 2019, the percentage of Lawrence police officers who were female increased from 14.2% to 18%. The average for all benchmark cities is 13.1%. (Boulder, Colo., 20.2%; Garland, Texas, 7.6%.)
• LPD had the second-highest percentage of sworn staff — which includes all officers, detectives, sergeants, captains and the chief — as a percentage of its total strength, with 85.2% sworn and 14.8% nonsworn staff. The average was 71.6% sworn and 28.2% nonsworn. (Olathe, 86.9% and 13.1%; Grand Prairie, Texas, 55.9% and 38%.)
• At the time of the survey, 4.3% of LPD’s officers were African American, and 4.4% of the city’s population was African American, compared to the averages of 5.3% and 7.5% of all the benchmark cities. Asian officers made up 1.4% of LPD’s ranks and 4.2% of the city’s population, compared to 2.6% and 9.9% averages. Other minorities made up 5.8% of LPD’s officers and 4.4% of the city’s population, compared to 4.6% and 8.1% averages. Hispanics made up 3% of LPD’s officers and 6% of the city’s population, compared to 11.9% and 15.1% averages.
• The average age of LPD’s officers is 38 years old; the average age for all benchmark cities is 39.7 years old. (Columbia, Mo., 37; Chula Vista, Calif., 44.) Beginning with the 2019 report, the survey tracked the percentages of sworn staff who were eligible for retirement — 5% of LPD’s sworn staff, compared to a 14.7% average. (Rochester, Minn., 4%; Garland, Texas, 38.7%.)
• Training costs for LPD are 0.4% of its budget; the average is 0.6%. (Coral Springs, Fla., 1.6%; Henderson, Nev., 0.1%.) For LPD, that was $581 per officer compared to the $1,502 average for all of the cities. (Fremont, Calif., $5,342; Grand Prairie, Texas, $425.)
• Lawrence police officers spent an average of 75 hours in training; the average for all benchmark cities was 100 hours. (Overland Park, 192; Garland, Texas, 31.)
• LPD cost each Lawrence resident $239 in 2019. The average of the benchmark cities is $279. (Boca Raton, Fla., $528; Springfield, Mo., $176.)
• Almost 80% of the survey cities had implemented body cameras. LPD was in the process of implementing them, and body-worn cameras were issued departmentwide in January. Of the five other cities that had not yet implemented body cameras in 2019, two had body camera programs in the works; the other three noted funding issues and/or lack of support.
Calls for service
• The five most common kinds of calls for service that LPD receives, in order from most to least frequent, are as follows: assist citizen, traffic accident, telephone report, alarm calls and check welfare.
• LPD’s clearance rate was 17.8% for crimes including aggravated assault, aggravated battery, arson, auto theft, burglary, homicide, rape, robbery and felony theft. (A crime is considered cleared when a suspect has been charged.) The average clearance rate for all of the cities was 25.4%. (Olathe, 61.7%; Chula Vista, Calif., 13.3%.) However, excluding arson, auto theft, burglary and felony theft, LPD’s clearance rate was 50% and the average was 55.1%. (Olathe, 84.8%; Naperville, Ill., 31.5%.)
• The value of stolen property reported to LPD was $2.57 million in 2019. That’s more than double the value in 2018, $1.13 million. The cities’ average for 2019 was $6.92 million. (Henderson, Nev., $31.88 million; Broken Arrow, Okla., $1.03 million.)
• Lawrence had 26.9 traffic crashes per 1,000 residents. The average was 19.2. (Cedar Rapids, Iowa, 47.6; Fremont, Calif., 3.6.) However, the city’s rate of injury crashes per 1,000 citizens was 2.8, below the average of 4.9. (Springfield, Mo., 11.7; Fort Collins, Colo., 1.6.)
• Lawrence had three fatal traffic crashes in 2019, two of which involved intoxicants.
• The top three causes of crashes in Lawrence, in order, were inattention, failure to yield the right of way and following too closely.
• 45.4% of traffic crashes in Lawrence resulted in citations, compared to the average of 57.1%.
• Lawrence police issued 85 traffic citations per 1,000 residents; the average was 121. Lawrence’s total has dropped off from 144 in 2015. (Norman, Okla., 322; Columbia, Mo., 31.)
• The average number of officer-involved traffic crashes per Lawrence police officer was 0.12, lower than the average of 0.16 for all benchmark cities. (Chesapeake, Va., 0.29; Bellevue, Wash., 0.03.) However, Lawrence had the second-highest percentage of traffic crashes where the police officer was at fault, 87.5% or 14 out of 16 crashes, which was above the average of 55.9%. (Carlsbad, Calif., 100%; Broken Arrow, Okla., 32.4%.) In terms of officer-at-fault crashes per 100,000 miles driven, Lawrence had a rate of 1.5, above the average of 1.1. (Fremont, Calif., 2.0; Bellevue, Wash., 0.3.)
Contact Mackenzie Clark
Have a story idea, news or information to share? Contact public safety reporter Mackenzie Clark:
Related coverage
• Aug. 7, 2020: Annual report: Violent crime and property crime dropped in Lawrence and Douglas County in 2019
• Aug. 1, 2020: City pursues outside study to inform ‘transformation’ of Lawrence police department
• July 22, 2020: Lawrence City Commission approves police union contract that includes changes to complaint procedures, pay raises for officers and detectives
• June 28, 2020: ‘What’s your badge number?’ Lawrence police technically don’t have them, but they should provide their names upon request
• June 15, 2020: A rundown of how Lawrence police can and cannot use their body cameras and how the public can record police interactions
• June 14, 2020: City leaders want a stronger police review board, more transparency on complaints against officers
• June 10, 2020: Lawrence Police Department finally releases report on use of force in 2019; 17 instances cited; officers’ actions found justified in all
• June 1, 2020: City leaders concerned over missing yearly reports from police; county leaders content with alternatives to sheriff’s reports
• May 31, 2020: Lawrence Police Department’s staffing near 10-year low; turnover is up and sworn experience is down
• May 17, 2020: Where are the reports? Lawrence police, Douglas County Sheriff’s Office explain the absence of documents about their performance
• Nov. 12, 2019: Lawrence City Commission approves spending additional $1M on $18.5M police headquarters
• May 9, 2018: Staffing study finds Lawrence police short on patrol officers
Public Safety
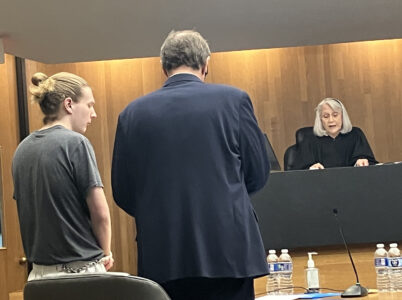
Less than two weeks from trial, teen accused of raping Lawrence 5-year-old takes plea deal
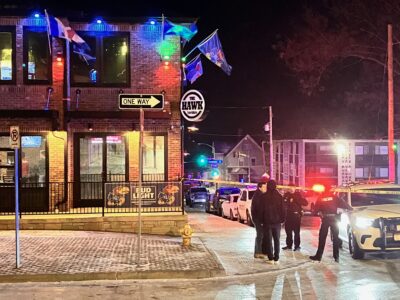
Affidavit: On night of shootings, underage males were rejected by The Hawk, but within an hour they bought phony wristbands from KU student and were admitted
23-year-old convicted of attempted murders, aggravated assault in 2022 Baldwin City shootings; he’s facing nearly 20 years in prison
Ex-Dillons employee accused of stealing $45K from store is getting a diversion, his lawyer says
Family says maintenance man shot raccoons to death in front of kids; police forward affidavit to DA