Photo gallery: Accident and fatality statistics for K-10 and I-70
These graphs compare statistics for accidents, fatalities, injuries and property damage on Kansas Highway 10 and Interstate 70 between Kansas City and Lawrence. The statistics for I-70 are from the East Lawrence exit to I-435. The statistics for K-10 are from Lawrence to I-435. The graphs do not account for the traffic volume for each highway.
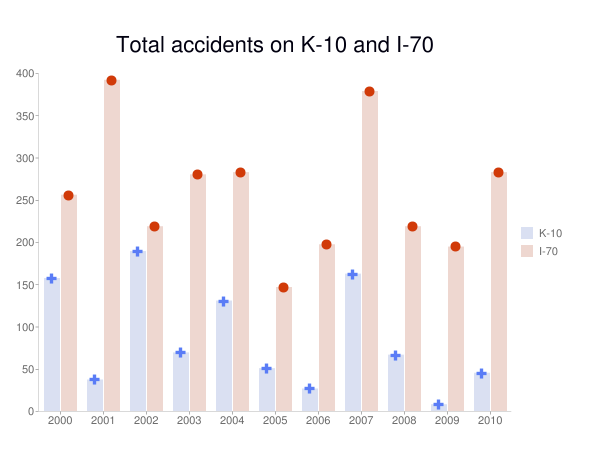
photo by: Whitney Mathews
From 2000 to 2010, Kansas Highway 10 has seen 2,840 accidents with an average of 258.18 per year. Interstate 70 has seen 3,553 total with an average of 323 per year.
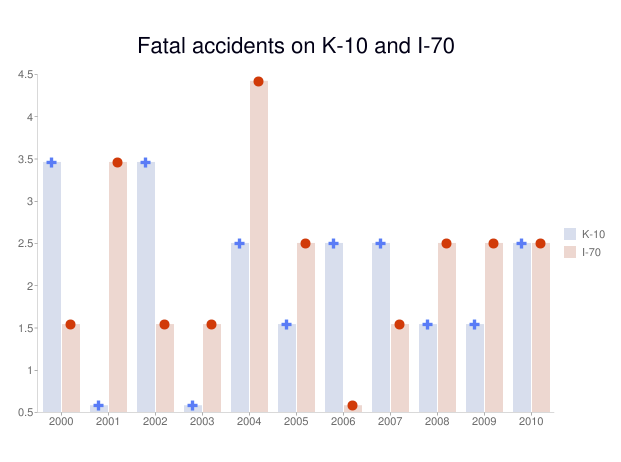
photo by: Whitney Mathews
From 2000 to 2010, Kansas Highway 10 saw 17 fatal accidents, averaging 1.55 per year. Interstate 70 saw 19 fatal accidents, averaging 1.73 per year.
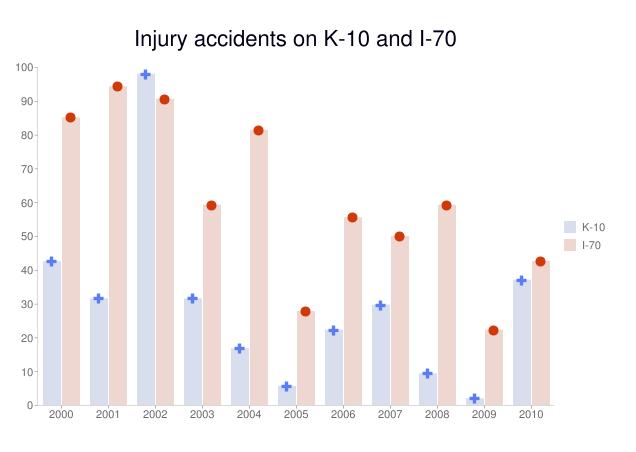
photo by: Whitney Mathews
From 2000 to 2010, Kansas Highway 10 saw a total of 561 injury accidents, averaging 51 per year. Interstate 70 saw a total of 746 injury accidents, averaging 67.82 per year.
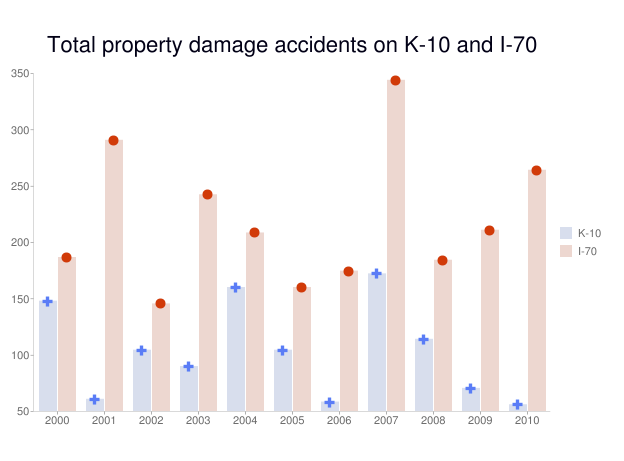
photo by: Whitney Mathews
From 2000 to 2010, Kansas Highway 10 saw 2,262 property damage accidents, averaging to 205.64 per year. Interstate 70 saw 2,788 property damage accidents, averaging to 253.45 per year.
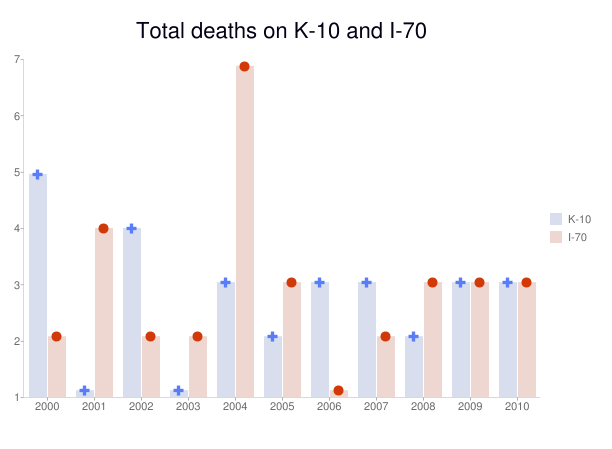
photo by: Whitney Mathews
From 2000 to 2010, Kansas Highway 10 saw 19 total deaths, averaging to 1.73 per year. Interstate 70 saw 21 total deaths, averaging to 1.91 per year.
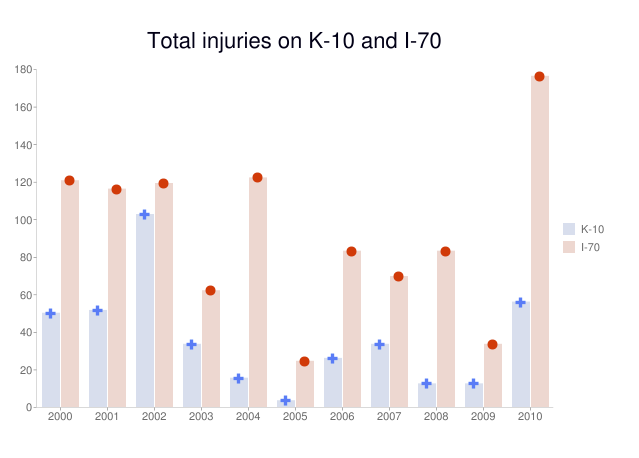
photo by: Whitney Mathews
From 2000 to 2010, Kansas Highway 10 saw 756 total injuries, averaging to 68.73 per year. Interstate 70 saw 1,164 injuries, averaging to 105.82 per year.
Galleries

Photo Gallery: Algeria holds Community Training Session at Rock Chalk Park

Photo Gallery: KU suffers season-ending loss to OU in super regional

PHOTOS: Kansas falls to Oklahoma in first super-regional game

PHOTOS: Lawrence PRIDE Parade
Photo Gallery: KU baseball team makes final preparations ahead of Lawrence Super Regional
Photo Gallery: Images from the 18th annual Rock Chalk Roundball Classic