A look at which Kansas counties have the highest wages and the best match between earnings and home values
Douglas County ranked worst in the state when comparing wages to home prices
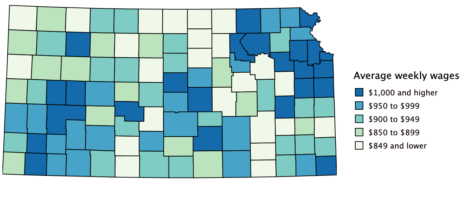
photo by: U.S. Bureau of Labor Statistics
The map shows average weekly wage totals for workers in each county in Kansas, as of September 2025.
Now that gas prices have you again thinking of ways to save money — carpooling, an electric vehicle, boarding a horse in the guest bedroom — I figured you might appreciate some new data on wages.
Specifically, there’s new data out that shows what a worker in Douglas County earns on average versus a worker in Johnson, Shawnee or any other county in the state. The numbers from the Bureau of Labor Statistics also show how many jobs and how many businesses exist in a county, which gives you a good lay of the land.
I’m not suggesting you use the numbers to quit your job and move to another county (that trip would take a lot of horse feed.) But as pocketbook issues are growing in importance, there’s no harm in understanding the economy around you.
Before we dive in, a couple of notes about the data. The wage and employment totals are for the third quarter of 2025 — meaning through September — which are the most recent figures available.
The second note is critical to understanding the figures. These numbers measure jobs that exist within Douglas County and workers who work within Douglas County. So, if you live in Douglas County but work in Johnson County, you are not going to show up in Douglas County’s totals. You’ll show up in Johnson County’s numbers. The reverse is also true: If you live in Johnson County but work in Douglas County, you will show up in Douglas County’s totals.
These numbers really are a snapshot of the type and quantity of jobs that exist in a county.
Highest and Lowest Wages
You likely are not shocked to learn that Douglas County does not top the list of highest wages in the state. You probably aren’t shocked either at what county does: Johnson. But perhaps No. 2 on the list is a surprise. Wyandotte, home to Kansas City, Kan., has the second highest wages in the state, yet it is not known for being a wealthy county.
But, remember, these numbers are measuring the jobs, not the residents of the county. The fact that Wyandotte has the second highest wages in the state but is often regarded as one of the more economically distressed counties is a strong indication of how many people work good jobs in Wyandotte County but live somewhere else.
The No. 3 county also is worth a mention. Coffey County is by far the smallest of any county that made the top 5. Its unique claim to fame is it is the only county in the state with a nuclear power plant, which provides some high-paying jobs.
Here’s a look at the top 5, the bottom 5, the state average and Douglas County’s rank.
Top 5
Johnson: $1,424 per week
Wyandotte: $1,309 per week
Coffey: $1,266 per week
Shawnee: $1,184 per week
Sedgwick: $1,171 per week
Bottom 5
Jewell: $733
Osage: $720
Chautauqua: $691
Elk: $680
Wallace: $658
Douglas County: $1,037 per week, which was No. 16 of 105 counties.
Statewide average: $935
Notes: Osage County, third from the bottom, borders Douglas County, which should serve as a reminder that you don’t have to travel far to see a whole different world. Fellow neighbor Leavenworth County was No. 6 on the list at $1,147, Jefferson County No. 10 at $1,077, Franklin County No. 19 at $1,019. Fellow university community — Riley County, home to K-State — was No. 13 at $1,048.
Where the Businesses Are
The BLS numbers measure “establishments” rather than businesses, which means it captures employees not only at for-profit companies but also at governments, schools, nonprofits, universities and basically every other place of work that is subject to unemployment insurance laws.
In terms of the total number of employers, Douglas County is right where you would expect it: It the fifth most populous county in the state, and it has the fifth largest number of employers at 3,710 establishments. The four counties with larger populations than Douglas — Johnson, Sedgwick, Shawnee and Wyandotte — took the top four spots.
A more interesting number is how many employers — establishments, if you want to use the technical term — exist per 1,000 residents. The number basically gives you an idea of whether you have a lot of workplaces or few workplaces for a community your size.
The average county in Kansas has 38 employers for every 1,000 residents. Douglas County is a bit below that average at 30 employers per 1,000 residents.
To see some counties that excel at that metric, we only need to turn our heads to the left or the right. Johnson County has 47 employers per 1,000 residents, while Shawnee County — certainly aided by all the state agencies located there — has 43 employers per 1,000 residents.
The counties that are tops in the state are generally isolated from any large cities nearby. The result is they have pretty sizable business bases compared to their populations because driving out of town to get your goods and services isn’t very convenient. Montgomery, Wallace, Greeley and Gove top the list, each with more than 60 employers per 1,000 residents.
Notes: Two of our neighbors found themselves in the bottom five of the state in this category. Leavenworth County was last at 20 employers per 1,000 residents. Osage ranked 102 in the state at 23. Jefferson County was only slightly better at No. 100 with 24, while Franklin was No. 89 with 26. Douglas County did fare better than Riley County, despite Riley being more geographically isolated from a major metro area. Riley had 27 employers per 1,000 residents.
Where the Jobs Are
Of course, not all employers are created equal. Some are small and some big. To see how robust of a job market a community has, you really need to look at the number of people who have jobs in the community, and then compare that number to the size of the community overall.
For that, I’ve simply calculated the number of jobs as a percentage of the county’s total population. No county has more jobs than it has residents — although that is theoretically possible, since these numbers count outside residents who come to the county for work. But having more jobs than residents is a very tough task in reality because every county has a sizable number of residents who don’t work, such as children and retirees.
The number does a fair job of identifying communities that are a hub for jobs. On that front, Douglas County is above average for the state. Douglas County had 51,143 jobs during the third quarter of 2025, while its 2024 population was just under 122,000 people. That’s a jobs percentage of nearly 42%. The average county was at 39%.
Top 5
Hamilton: 61%
Johnson: 58.8%
Nemaha: 58.2%
Shawnee: 57.6%
Saline: 56.9%
Bottom 5
Ottawa: 21.2%
Chautauqua: 20.9%
Woodson: 20.7%
Wabaunsee: 19.2%
Osage: 18.5%
Notes: As a proud native of Osage County, this is getting a little hard to report. As for our neighbors: Jefferson, No. 99 at 22%; Leavenworth No. 96 at 25.5%; Franklin No. 53 at 38.6%. Our K-State cousin of Riley was slightly better than Lawrence at 42.1%, topping Douglas County’s number of 41.9%.
Wages vs Housing
It is hard to find a public policy issue getting more attention than housing affordability currently. So, I wanted to do something that tried to put these county wage numbers into perspective with county housing prices. What I came up with isn’t perfect because I had to use a 2023 dataset in order to get a median housing value for every county in Kansas. (The bigger counties have more recent data, but the smaller ones don’t.) Thus, we are using late 2025 wage totals but 2023 housing numbers. That’s not ideal, yet the results are worth passing along, especially if you are worried about affordability in Douglas County.
Indeed, Douglas County had the worst ranking in the state when comparing wages to median housing values.
I created the list by converting weekly wages into annual earnings. Thus, Douglas County’s weekly wages of $1,037 multiplied by 52 weeks equals $53,924 in annual wages. Douglas County’s median housing price — according to the Census Bureau’s American Community Survey program — was $281,600. That means the average annual wage in Douglas County was 19.1% of the median price of a home in the county.
The statewide average was 41%. This isn’t the only metric that points to Lawrence’s housing affordability problem, but it is a fairly stark one.
Top 5
Stanton: 73.5%
Edwards: 68.9%
Comanche: 67.9%
Harper: 63.8%
Clark: 62.1%
What that list tells you is that one solution to housing affordability is to be a really small county that has very little demand for housing, which will keep housing prices really low. Each of those counties has a population of less than 5,500 people, and median home values of less than $80,000.
Bottom 5
Douglas: 19.1%
Miami: 19.6%
Johnson: 20.2%
Leavenworth: 22.9%
Ellis: 23.2%
What that list will tell you is that our corner of the world is in hot demand for housing. You could travel to Douglas, Miami, Johnson and Leavenworth counties and never have to step foot in a fifth county. In terms of the county that was No. 5 on the list, Ellis is home to Hays.
Notes: Riley County, which also has experienced some housing affordability issues, fell just outside the bottom 5. It was sixth worst at 23.6%. In terms of our other neighbors, Osage was No. 94 at 26.2%; Jefferson No. 88 at 27.9%, Franklin No. 87 at 28.3% and Shawnee No. 68 at 36.1%.
The only county in the Douglas County vicinity that scored above average was Wyandotte, No. 41 at 44.6% compared to the statewide average of 41%.
Town Talk column
A look at which Kansas counties have the highest wages and the best match between earnings and home values

Former pool hall space to become a ‘pubcade’ with video games, pinball, Skee-Ball, plus full service bar

Lawrence developer has trio of projects underway, ranging from $600K row houses in downtown to new neighborhoods on city’s edge

Despite surprise ‘no’ votes this week, city commissioners want public, state officials to know they still support affordable housing

Deal getting close for hotel to build at 11th and Mass; speculation has Graduate by Hilton brand coming to the site