Retail sales in Lawrence grow in 2025, exceed city’s budget projections; a look at area communities, too
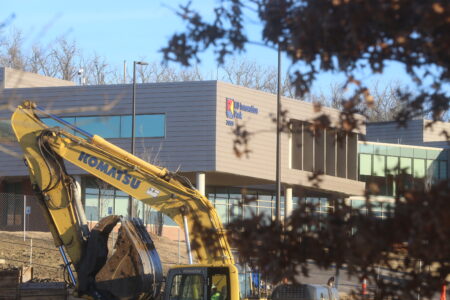
De Soto has added more than $90M in taxable sales since Panasonic plant came to town
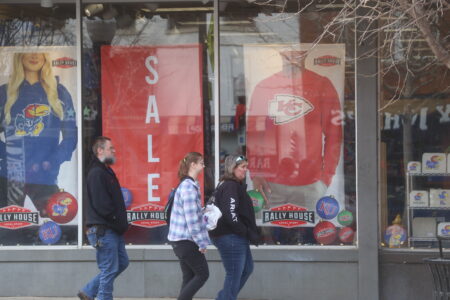
photo by: Chad Lawhorn/Journal-World
Shoppers stroll in downtown Lawrence on Jan. 2, 2026.
When it comes to Lawrence shoppers and their spending, 2025 ended up being a perfectly ho-hum year — delivered via a roller coaster.
The City of Lawrence recently received its 12th and final sales tax check of the year from the Kansas Department of Revenue. With that, we can now calculate how much consumers spent in the Lawrence economy during the last 12 months.
The tally: $2.05 billion in taxable sales occurred in Lawrence. That was up 4% from the same period a year ago.
Given that general U.S. inflation for 2025 is projected to finish between 2.7% and 3%, that would mean consumers probably increased the amount of stuff they were buying by about 1%, with the rest of the sales coming as the result of higher prices for the same amount of goods.
A net 1% increase in local spending is nothing spectacular — neither on the good or the bad side. But it likely is welcome news at Lawrence City Hall. That’s because the City of Lawrence is coming off two consecutive years of being aggressive in its estimates for sales tax collections, only to see them come in far less than expected. You may recall about $6 million in budget reductions that the city implement in 2025. That was largely due to shortfalls in sales tax collections in both 2023 and 2022.
The 2025 sales tax returns shouldn’t create any such pressure. Thanks to the 4% growth in regular sales tax collections, and about $10 million in special sales tax collections called a “use tax” that is charged primarily on internet purchases made by Lawrence residents, the city met its sales tax budget. It actually exceeded it by more than $1 million.
The city’s 2025 budget called for $55.08 million in sales tax collections, which includes the special use taxes. My preliminary tally from numbers provided by the Kansas Department of Revenue shows the city collected $56.2 million. In other words, sales tax collections exceeded the city’s expectations by about 2%.
It didn’t always look like that was going to be the case. That’s where the roller coaster element comes into play. Early in the year, it looked like Lawrence may have a fantastic year of sales tax collections. For example, data from the state showed sales in the February reporting period were up 18% from a year earlier. That had the look of fool’s gold, and it indeed was. From the March through September reporting periods, retail sales numbers were largely stagnant to declining. During that stretch, there was reason to question whether the city would make its budget for 2025.
But there was a comeback in the late part of the year. The October reporting period was up by more than 8% and the November reporting period was up by more than 9%. That, combined with the special use tax dollars coming in relatively strong, pushed the city to a slight surplus.
In terms of how Lawrence finished the year, the December reporting period was up 5.1% compared to the same period a year ago. As a reminder, there is some lag time in the state’s reporting periods, meaning the December period actually captures sales made from mid-October to mid-November. So, the December report catches the tail end of football season but probably isn’t a great gauge of how the holiday shopping season panned out for local retailers. The January and February reports will provide more of an indication on that front.
One other note about the numbers, some of you probably remember the city sales tax rate increased in 2025. It went up by 0.05 of a percentage point — a nickel for every $100 purchased — after voters approved the increase in November 2024 to fund affordable housing efforts.
The growth numbers that I report account for that increase in a way to make sure that when we compare this year to last year that we are comparing apples to apples. (The growth percentages are measuring the amount of total retail sales rather than the total amount of sales taxes collected.)
The one negative from the 2025 numbers is that city planners long have set 5% as the sales tax growth rate they like to see in order to adequately finance capital improvements and pay for basic city services. As a reminder, sales taxes are one of the largest sources of income the city receives in a year. So, the 4% growth rate fell just below that target, but was within striking distance.
Importantly, the city’s 4% growth rate for 2025 was better than the state as a whole. Local sales tax collections across the state increased by 3.4%, according to information from the Department of Revenue.
In fact, Lawrence fared relatively well compared to the other large retail centers that we track. It was tied for the fourth-best growth rate among the 10 communities. Here’s a look at the 12-month growth rates for those communities.
• Manhattan: up 4.3%
• Sedgwick County: up 4.9%
• Salina: up 4.1%
• Olathe: up 4.0%
• Lawrence: up 4.0%
• Merriam: up 3.2%
• Lenexa: up 3.5%
• Topeka: up 2.3%
• Kansas City, Kan: up 2.2%
• Shawnee: up 2.1%
• Statewide: up 3.4%
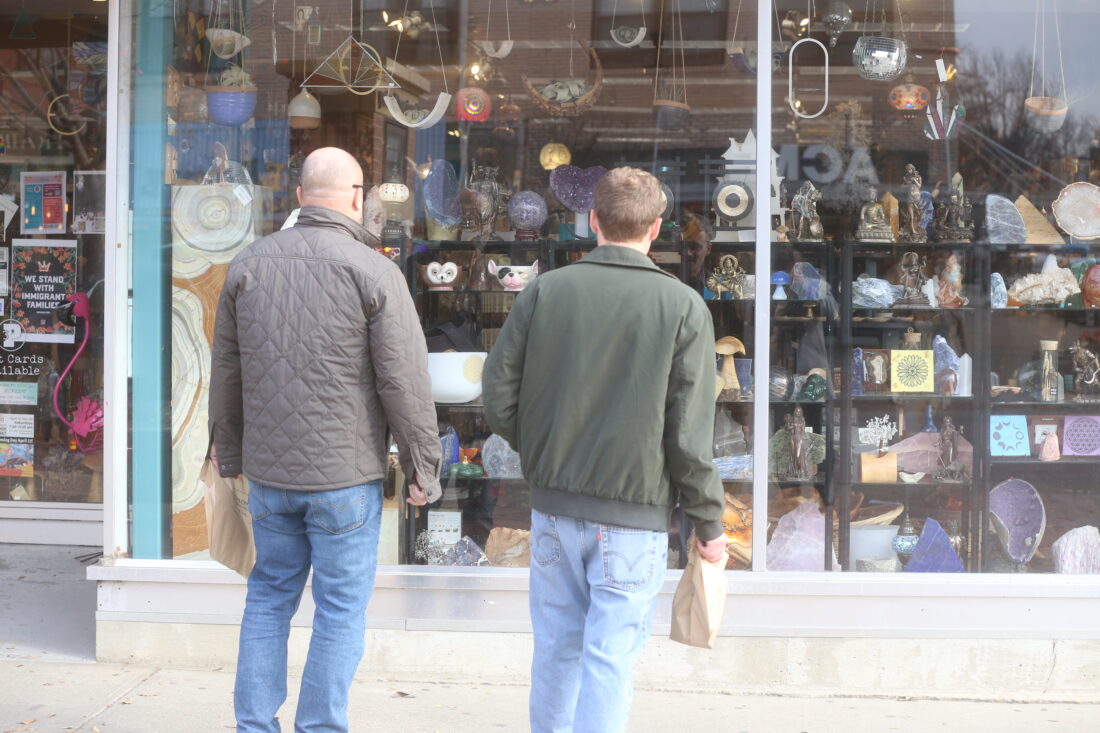
photo by: Chad Lawhorn/Journal-World
A pair of shoppers look at a storefront display in downtown Lawrence on Jan. 2, 2026.
Since we are at the end of the year, I thought it also would be fun to calculate the total retail sales for the largest communities in the state. (I was a real blast at the New Year’s Eve party.) This gives you an idea of where Lawrence’s retail industry ranks among some of the other big players in the state.
• Overland Park: $5.08 billion
• Olathe: $3.44 billion
• Topeka: $3.32 billion
• Kansas City: $3.02 billion
• Lawrence: $2.03 billion
• Lenexa: $1.84 billion
• Manhattan: $1.42 billion
• Salina: $1.38 billion
• Shawnee: $1.28 billion
• Merriam: $1.06 billion
One note, Wichita would be high on this list, but it does not charge a citywide sales tax, so I don’t get any data for the city from the Kansas Department of Revenue.
To really have fun, you compare those retail sales numbers to the size of the city’s population and you can get a sense of which communities do the best job of attracting outside shoppers into their stores and keeping local shoppers from going elsewhere to shop. But I’m running low on party streamers, so let’s save that fun for a later day.
Besides, I still need to report year-end totals for a host of smaller communities in the Lawrence area. Here’s a list of those communities with their growth rate, followed by their total retail sales.
• Perry: up 12.5% ($10.6M)
• De Soto: up 8.1% ($139.4M)
• Basehor: up 8% ($77M)
• Gardner: up 6.9% ($346.3M)
• Overbrook: up 6.8% ($11.6M)
• Franklin County: up 4.4% ($459.8M)
• Spring Hill: up 3.8% ($120M)
• Jefferson County: up 3.0% ($161.9M)
• Baldwin City: up 2.6% ($45.8M)
• Bonner Springs: up 1.1% ($246.3M)
• Tonganoxie: down 0.4% ($68.6M)
• Eudora: down 2.5% ($42.5M)
• Leavenworth: down 2.6% ($502.5M)
• Lecompton: down 4.8% ($4.1M)
• Wellsville: down 5.7% ($19.4M)
You’ll note that De Soto, home of the new Panasonic battery plant, is near the top of the list again with an 8.1% growth rate. However, you also may remember that it finished last year with a 49.8% increase.
So, the boom from the $4 billion battery plant is starting to slow down, but what a boom it has been. The more interesting number with De Soto is the total amount of retail sales it has for a city its size. De Soto and Eudora are 8 miles apart, and the Census Bureau estimated this year that De Soto had 15 more people than Eudora. Both have populations of about 6,500. But De Soto’s 6,500 population town had $139 million in taxable sales, while Eudora had $42 million. The biggest difference, of course, is one has a $4 billion battery plant and the other doesn’t.
Just for fun, I looked up Department of Revenue data for De Soto dating back to 2021, which is the year Panasonic announced it would build a plant in De Soto. The community had retail sales of just more than $50 million that year. In other words, there was nearly an additional $90 million in taxable sales happening in De Soto in 2025 that didn’t occur prior to the plant.
Town Talk column
Retail sales in Lawrence grow in 2025, exceed city’s budget projections; a look at area communities, too
Plans progressing for $55M national security center on KU’s West Campus; National Weather Service set to locate in center
Plans filed to annex new land into the city, add about 200 homes along Queens Road in northwest Lawrence

KU spinoff company wins $1.2M federal grant to help it become major commercial entity in refrigeration industry

Lawrence homes sales are up for the year, and selling prices are increasing much slower than normal