Lawrence ranks below average for diversity, but so do most Midwestern college towns, report finds

photo by: Shawn Valverde/Special to the Journal-World
Downtown Lawrence, looking north, is pictured in this aerial photo from September 2023.
I’m going to take a risk here and hope that a black government SUV doesn’t pull up beside me. (Does Tesla make black SUVs?). I’m going to talk about diversity.
It seems like the thing to do because there is a new national ranking out, and it may help shed light on a misconception that some people have about Lawrence — namely, that it is diverse.
I’ve written several times over the years about how the statistics show Lawrence is not a diverse place, if you are measuring traditional metrics like race, ethnicity, language and such. This latest report from the financial website WalletHub, which used Census data to compile its rankings, placed Lawrence well below average when it comes to diversity. Lawrence ranked 326 out of 500 cities measured. In other words, not quite in the bottom quartile, but fairly close.
I’ve followed the study for years, and that is a pretty typical finding for Lawrence. Yet, Lawrence’s status as a college town sometimes causes people to immediately slap a diversity label on it. Folks who do that may be confusing diversity with openness. You could argue that Lawrence is more open to different lifestyles and beliefs than other communities in the region.
Then again, some would push back on the openness idea too. If political affiliation is any indicator, Lawrence wouldn’t rank high on diversity of political thought, for instance. The WalletHub report doesn’t measure that, but you could find many communities where Democrats and Republicans exist in more equal numbers than they do in Lawrence. For example, the difference between registered Democrats and Republicans in neighboring Johnson County is 9 percentage points. In Douglas County, it is 20 percentage points.
What makes Lawrence stand out is that Democrats outnumber Republicans by 20 percentage points, where most every other county in the state has Republicans outnumbering Democrats. That makes Lawrence different, and sometimes people may mistake different and diverse to be one and the same.
This year — given the national conversation, or at times, executive orders — there is another factor I looked at with these numbers. It goes back to Lawrence’s standing as a college community. There’s definitely a narrative that the academic community has done more than most to promote the value of diversity, equity and inclusion.
However, the numbers show that if you live in a college community — especially one in middle America — the odds are high that you are living in a community that ranks below average in diversity.
I looked up the rankings of 10 major college communities in Kansas, Nebraska, Missouri, Oklahoma, Iowa and Colorado. None of the 10 towns ranked in the top half of the report of 500 communities. Iowa City was the closest at 262. Lincoln, Nebraska, ranked the lowest at 367. The average ranking for the group was 328, meaning Lawrence ranked just about average for a Midwestern college community but quite a bit below average for a U.S. community in general.

photo by: John Hanna/Associated Press
This photo from Friday, April 12, 2024, shows the sign above the door to the Office of Diversity, Equity, Inclusion and Belonging inside the main administration building on the main University of Kansas campus in Lawrence, Kan. Republican lawmakers across the U.S. are seeking to restrict diversity initiatives on colleges campuses, arguing that they enforce a liberal orthodoxy.
Below are a list of rankings for those 10 college communities, broken down by several different categories. Also included in the list are the other seven Kansas communities that were included in the report.
No, Lawrence doesn’t rank the highest among Kansas communities when it comes to diversity. Kansas City, Kansas, is top in the state, and by a wide margin. It ranks 57th in the country. Lawrence, though, also isn’t last. Salina takes that spot at No. 394. Lawrence ranked No. 6 out of the nine Kansas communities in the report. Only KCK and Wichita were ranked among the top half of diverse communities in the nation.
The report measures diversity by three categories: racial and ethnic diversity, diversity in the type of language spoken, and diversity in residents’ birthplaces. An important concept to remember with the report is that it is measuring how many different types there are in a community, not how different the types are from the norm. In other words, the report is not measuring which communities are the least white and calling that diversity. For example, the least diverse community in the report is Hialeah, Florida. That’s not because it is a white, rich retirement community. Rather, the ranking is largely due to the fact that more than 95% of all residents are Hispanic or Latino, which makes it one of the most Hispanic communities in the country. Thus, by definition, not diverse.

photo by: AdobeStock
Iowa City, Iowa is pictured in this undated aerial photo.
The first list is the overall ranking, which used the rankings related to race, ethnicity, language and birthplace to come up with an overall average for each community.
• Kansas City, Kansas: No. 57
• Wichita: No. 194
• Iowa City: No. 262
• Overland Park: No. 284
• Olathe: No. 289
• Norman, Oklahoma: No. 295
• Stillwater Oklahoma: No. 309
• Topeka: No. 321
• Lawrence: No. 326
• Columbia, Missouri: No. 336
• Fayetteville, Arkansas: No. 342
• Ames, Iowa: No. 346
• Manhattan: No. 347
• Fort Collins, Colorado: No. 349
• Shawnee: No. 362
• Lincoln, Nebraska: No. 367
• Salina: No. 394
In case you are wondering, I didn’t intentionally omit Boulder, Colorado, home to the University of Colorado. The WalletHub report did not rank Boulder.
The next list is the rankings based just on racial and ethnic diversity.
• Kansas City: No. 20
• Wichita: No. 201
• Topeka: No. 264
• Norman: No. 302
• Stillwater: No. 315
• Iowa City: N. 322
• Columbia: No. 324
• Fayetteville: No. 328
• Lawrence: No. 331
• Olathe: No. 335
• Overland Park: No. 336
• Manhattan: No. 345
• Lincoln: No. 364
• Ames: No. 370
• Salina: No. 367
• Shawnee: No. 375
• Fort Collins: No. 379
Next is a ranking based just on language spoken within a resident’s home.
• Kansas City: No. 90
• Iowa City: No. 190
• Wichita: No. 200
• Olathe: No. 223
• Overland Park: No. 232
• Ames: No. 253
• Lincoln: No. 255
• Stillwater: No. 298
• Shawnee: No. 300
• Norman: No. 302
• Lawrence: No. 316
• Columbia: No. 319
• Fort Collins: No. 341
• Manhattan: No. 345
• Salina: No. 356
• Topeka: No. 356
• Fayetteville: No. 381
Last is a ranking based on where residents of a community were born. The survey categorized the birthplace of every resident by geographic region of the U.S. and then also looked at the number of foreign-born residents.
• Fort Collins: No. 35
• Overland Park: No. 77
• Fayetteville: No. 135
• Olathe: No. 149
• Lawrence: No. 169
• Manhattan: No. 173
• Iowa City: No. 181
• Shawnee: No. 195
• Stillwater: No. 206
• Norman: No. 213
• Kansas City: No. 204
• Ames: No. 221
• Columbia: No. 301
• Wichita: No. 334
• Lincoln: No. 382
• Topeka: No. 414
• Salina: No. 418
You may note that the birthplace category is the one category in this report in which Lawrence finished above average. Seemingly, that is a sign that Lawrence has an above-average amount of opportunities — whether that be school or jobs — to attract and keep residents who don’t have a natural connection to the community. It also is worth noting that Overland Park and Olathe, two of the highest paying locations in the state, were tops among Kansas communities.
Town Talk column

Latest Census numbers show Lawrence lost population; only Kansas city of 40K or more to post a loss
Costco gets its building permit from City Hall; Walmart also moving ahead with gas station plans

How big a deal will the World Cup be? City could collect a windfall to help with 2027 budget
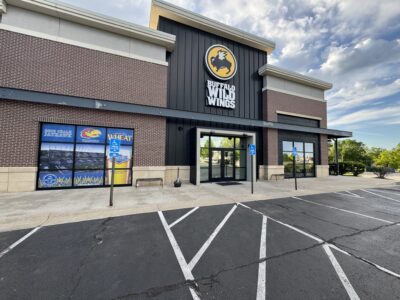
Buffalo Wild Wings closes its sole Lawrence location
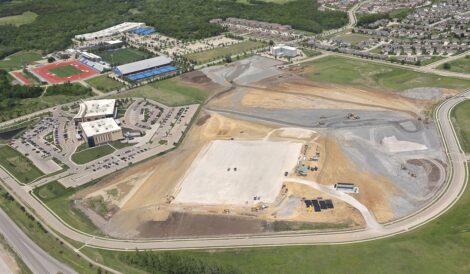
Plans to annex 650 acres west of the SLT get delayed; Lawrence home sales fall, but prices do too in March