Lawrence home sales fall in 2021 as home prices increase by more than 11%

photo by: Shutterstock
In the battle between Lawrence homebuyers and Lawrence homes, the homes won in 2021.
The number of homes sold in Lawrence declined by about 4% compared to a year ago, as home prices soared to new highs and competition for the few homes on the market stiffened.
There were 1,290 home sales in Lawrence during 2021, according to the year-end report from the Lawrence Board of Realtors. That was a drop of 3.7% from a year ago and marked the second time in three years that the number of homes sold in Lawrence has dropped. Home sales fell by about 2% in 2019, but bounced back in 2020 with an 11% gain.
Real estate professionals had hoped to keep the momentum going in 2021, but failed to do so. A big reason why: A big increase in selling prices.
The median selling price for a home in Lawrence jumped 11.3% to $263,121. That’s up from $213,000 at the end of 2019. In other words, the price to buy a house in Lawrence is up about 23% over the last two years, an increase far greater than inflation or average income growth for families.
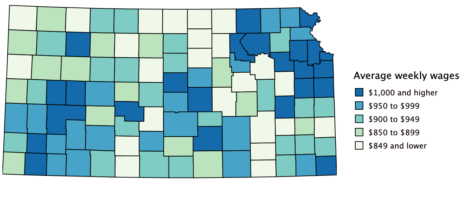
Lawrence isn’t alone is seeing big increases in prices. The Kansas City metro area saw its median home sale price increase by 10.6% to $260,000. Topeka also saw its home prices jump by a whopping 17.9% to $165,000.
But both Topeka and Kansas City saw an increasing number of home sales in 2021, with 1.9% and 3.8% growth respectively. Compare those numbers to the declining home sales in Lawrence, and it may be a sign that Lawrence buyers are having a harder time affording homes, or perhaps just finding homes for sale.
There are two numbers that show how fierce it can be to find a home in the Lawrence market currently. The first is the number of days a home sits on the market before it sells. For all of 2021, the median was four days, down from seven a year ago and 14 two years ago. Compare that to Kansas City, where homes were on the market for 24 days, on average, before selling.
The second is how much homebuyers are paying versus the listing price of the home. In 2021, buyers paid, on average, 101.4% of a home’s listing price. In other words, if a home was listed for $300,000, the statistics suggest it ultimately sold for $304,200. It is unclear when, if ever, Lawrence finished a year where the average selling prices of homes exceeded the average listing prices of homes. It has not happened in recent memory, according to past reports from the Board of Realtors.
Here’s a look at some other statistics from the recent report:
• The Lawrence market ended the year with 80 homes for sale. That basically was unchanged from the 81 homes for sale at the end of 2020. But it was down significantly from the 218 homes that were for sale at the end of 2019.
• The median listing price for those 81 homes was $351,250, up nearly 30% from the $273,000 median last year at this time.
• Of the 81 homes on the market, there are 12 that are between the $150,000 and $300,000 price range.
• Despite a decline in the number of homes sold, the total dollar value of homes sold in Lawrence increased in 2021, thanks to the higher selling prices. The real estate industry sold $382.1 million worth of homes during the year, up 9.8% from a year ago.
Lots of communities have put out year-end housing reports in recent weeks. Here’s a look at some of the median selling prices in other communities or counties nearby. Some of the counties have a pretty small number of sales, which means the median selling price can fluctuate a lot from year to year, but the numbers are still interesting nonetheless. It provides a little more perspective on where Lawrence home prices rank in the region. What the prices by themselves don’t do is give a glimpse at affordability, since average income totals vary a lot from community to community.
• Johnson County: $365,000
• Miami County: $275,000
• Cass County, Mo.: $272,500
• Leavenworth County: $265,000
• Clay County, Mo.: $264,000
• Lawrence: $263,121
• Kansas City metro: $260,000
• Jackson County, Mo.: $223,650
• Wichita/South Central KS: $185,100
• Wyandotte County: $180,000
• Jefferson County: $180,000
• Franklin County: $175,000
• Topeka metro: $165,000
• Shawnee County: $165,000
• Lyon County: $142,000
• Osage County: $135,000
Town Talk column

Retail sales in Lawrence start 2026 slower than a year ago; sales tax collections coming in below other retail markets
Uplift Coffee signs deal to expand into downtown Lawrence in former Rusty Taco location

As housing starts slump in Lawrence, Douglas County loses population in 2025; only urban county in Kansas to post a loss