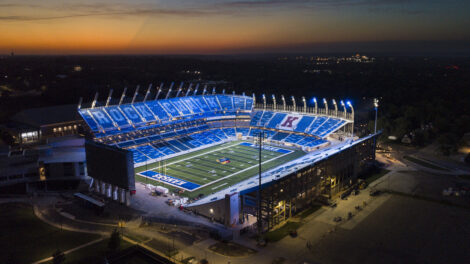
With high-tech satellites, KU researchers launch web program that measures how green the Earth has been

photo by: Screenshot Sentinel GreenReport Plus
A screenshot from KU's new Sentinel GreenReport Plus program shows data for farm field east of Lawrence.
For generations, a certain segment of Kansas’ population has shared morning coffee at the small town diner, talked about the weather and debated how good or poor the crops look.
Now, you might be able to whip out your smartphone and prove your point, thanks to satellites in space and University of Kansas researchers.
KU researchers who specialize in remote sensing have launched a nationwide, web-based app that takes familiar Google Earth maps and supercharges them with nearly real-time data that shows how a particular cornfield — for example — is growing now versus years ago.
The program is called Sentinel GreenReport Plus, and it is free for the public to use. KU researchers believe there will be a fairly signifiant list of people who will be interested in the information.
“It could be vegetation in a forest community, a cropland community or on rangeland,” Dana Peterson, a senior research associate for KU, said in a press release. “We could create a tool that would allow access to these data easily and create an interface where people — whether educators, researchers, ranchers or cropland producers — could access the imagery easily and look at vegetation health.”
Peterson — who is part of KU’s remote sensing program and the director of KansasView, a consortium that aims to improve mapping of the state and the U.S. — said a key to the program is that it is using particularly powerful satellites. It uses satellites from the European Space Agency’s Copernicus Sentinel-2 satellite mission.
The satellites are able to capture images so that one pixel shows an area that is 10 meters by 10 meters square, which allows for much more detail about the conditions of plants that are growing on the patch of land. More traditional satellites capture images so that one pixel shows an area that is 1,000 meters by 1,000 meters square.
“Remote sensing and satellite imagery technology has been improving in terms of the spatial footprint that it can represent in a pixel,” Peterson said.
The imagery is so detailed that it actually can show damage to crops, forests or structures after a natural disaster.
“We’ve also looked at some of the burn events and wildfires,” Peterson said. “You can look at how the vegetation has been damaged and to what extent and severity.”
However, back to that morning coffee table, you really could use the program to settle that debate about whether this year’s crop is the worst in years. The program allows a user to home in on a specific farm field. The program even will tell you which years the field was planted with corn versus soybeans, for example.
“We can look at vegetation health at the crop-type level,” Abinash Silwal, KU graduate student and tech lead in the project, said via press release. “For example, if I want to monitor my field of corn, I can select ‘corn’ in the app and draw a rectangle or polygon around the area. The tool instantly displays multiple charts, including a time series and comparison charts showing current vegetation health relative to historical averages. This helps determine whether the crop’s current condition falls within the normal range or is showing signs of stress.”
The information displayed is very current. For example, a user on May 28 could select the large farm fields along Kansas Highway 10 just east of Lawrence near the waterski lake and receive information dating to May 20. The user also could see at a glance that about 75% of the land was planted in corn in 2024, while about 70% was planted in soybeans in 2023, and it was about 60% corn all the way back in 2008.
The user also could quickly see that 2023 and 2024 were some of the better years for corn, while 2018 was one of the tougher years for the crop on that particular parcel. The KU researchers also have added historical rainfall data to the program.
“The addition of the precipitation curve is the coolest thing,” Silwal said. “If I see that vegetation health is below normal and the precipitation curve is flat or shows significantly lower rainfall compared to the 30-year historical statistics, we can infer that drought may be contributing to the stress.”
KU, which has long had a national reputation for its research in remote sensing technology, has operated a similar crop monitoring program — called the GreenReport — since 1996 in conjunction with NASA. KU researchers decided to launch the improved Sentinel GreenReport Plus after gaining access to the images from the Sentinel satellites that produce the more detailed images.
Peterson said the improved images and data should pay dividends through better-informed agricultural producers, policymakers, insurers and research ecologists in Kansas and across the nation.
It also might be particularly helpful in the field of climate science, she said, noting the data might represent “a better way to understand the interplay of climate and vegetation. Users can visualize trends, generate crop-specific charts and download outputs to support reports, presentations and further analysis.”
— Journal-World Editor Chad Lawhorn and KU News Services contributed to this report.
KU
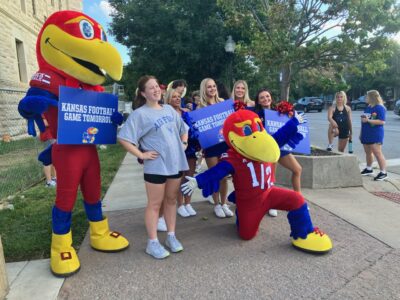
PHOTO: KU spirit on Massachusetts Street ahead of Friday night’s football game
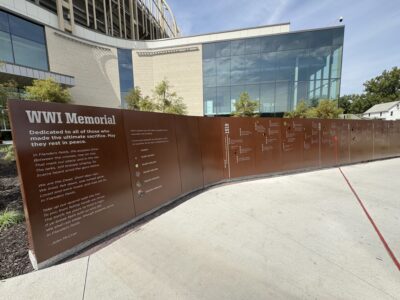
KU on Friday to highlight football stadium’s role as a World War I memorial; plaza honors 130 from KU who served, died
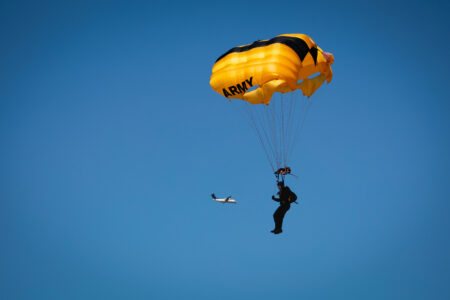
What to know to go to KU’s revamped football stadium on Saturday; flyovers, parachutists and coordinated clothing
New exhibit at KU’s Spencer Museum of Art explores how humans relate to the ocean

As college athletics undergoes big change, KU’s Girod appointed to serve on NCAA’s governing board