Census reveals disparity in rates of uninsured
Washington ? New census data released Tuesday confirm a huge spread in the rate of uninsured from state to state and the big difference in impact that can be expected as a result of the health care overhaul recently passed by Congress.
The statistics are for 2007 and show health insurance coverage by state and for each of the country’s roughly 3,140 counties.
The numbers do not include the impact on millions of people who lost their jobs and health insurance after the recession began in December 2007.
The 2007 snapshot shows that Massachusetts, which has achieved near-universal coverage, had the lowest rate of uninsured people under age 65, about 7.8 percent. States with the highest rates of uninsured were in the South and West: Texas was at the top, with 26.8 percent, followed by New Mexico (26.7 percent) and Florida (24.2 percent).
In the Washington area, the District had the lowest rate of uninsured, about 11.9 percent, among the three jurisdictions. Maryland’s rate of uninsured was 14.5 percent, and Virginia’s was 15 percent. The data for the insured include those with public or private insurance.
The disparities are even greater at the county level, where Henry County, Iowa, and Plymouth County, Mass., tied for the lowest rate of uninsured in the country, about 6.6 percent of people under 65, with a margin of error of about 1 percentage point. By comparison, the 14 counties with the highest rates of uninsured were in Texas, with a nearly 50 percent uninsured rate in Kenedy County.
Under the new law, virtually all Americans will be required to buy health insurance by 2014 or pay a penalty tax.
City Government
Developer seeks incentive from City of Lawrence to build 131 units of housing near Wakarusa and Queens

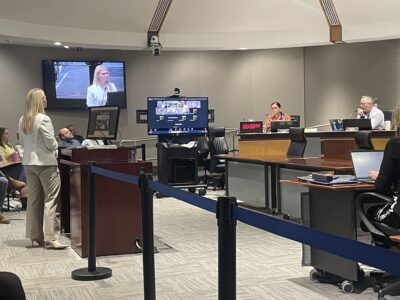
Lawrence city leaders will consider whether to keep Community Building open, make 2 other rec centers free to access
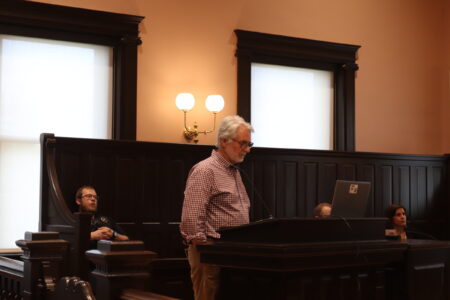
A STAR Bond application raises questions for city leaders about Costco and housing west of the SLT
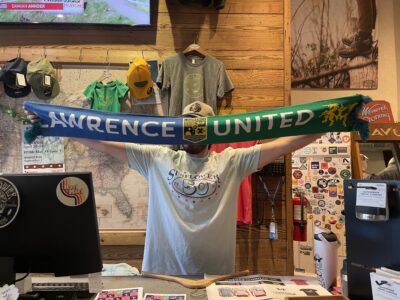
Soccer gear honoring Lawrence history’s all-star team is now on sale as part of city’s public art exhibition
To honor public servants, Lawrence’s July 4 celebration will have a whole gallery of their photos on display; submissions open now