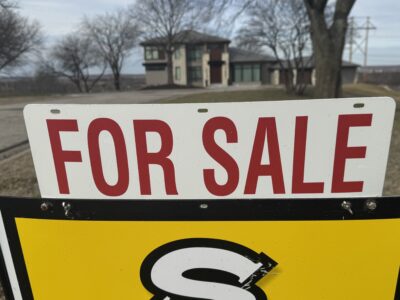
Local holiday sales show slight growth in 2025; new state report looks at how well Lawrence attracts out-of-town shoppers
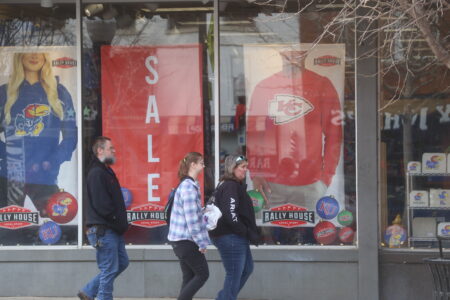
photo by: Chad Lawhorn/Journal-World
Shoppers stroll in downtown Lawrence on Jan. 2, 2026.
While it doesn’t get nearly as much attention as its cousin “Have a Holly Jolly Christmas,” the song “Have a Nearly Average Christmas” would fairly well describe the Lawrence holiday season.
At least, that’s what the latest retail sales numbers from the Kansas Department of Revenue suggest.
The latest sales tax report from the state — which generally includes the big holiday shopping season of mid-November to mid-December — shows retail sales in Lawrence were up 2.7% compared to the same period a year ago. Statewide, retail sales tax collections were up 2.9% from a year ago.
The City of Lawrence recently received from the state its first of 12 sales tax checks for calendar year 2026. The 2.7% growth rate is quite a bit less than the 4% growth rate that the city posted for all of 2025.
However, one month’s worth of sales tax data isn’t very useful in determining trends in the retail market, as there is a lot of variability from month to month. Once we get three or four months worth of data, we’ll have a better idea of what type of year it is shaping up to be for the Lawrence consumer economy.
This latest report — dubbed the January report because the check comes in January — is useful at providing an indication of what type of holiday shopping season local retailers experienced. On that front, I would say it was pretty similar to last year. A 2.7% increase might represent a little bit of an increase in the volume of sales, but not much when you factor in inflation.
The other question worth pondering is how did Lawrence do compared to other large retail centers in the state? Those results are singing from the same sheet of music. Lawrence is in the middle of the pack, or about average. Here’s a look at the growth rates for the other big retail centers that we track:
• Kansas City, Kan.: up 9.0%
• Sedgwick County: up 7.4%
• Lenexa: up 7.1%
• Olathe: up 6.9%
• Shawnee: up 3.4%
• Lawrence up 2.7%
• Overland Park: up 2.2%
• Merriam: up 1.5%
• Salina: up 1.3%
• Topeka: down 0.2%
• Manhattan: down 3.2%
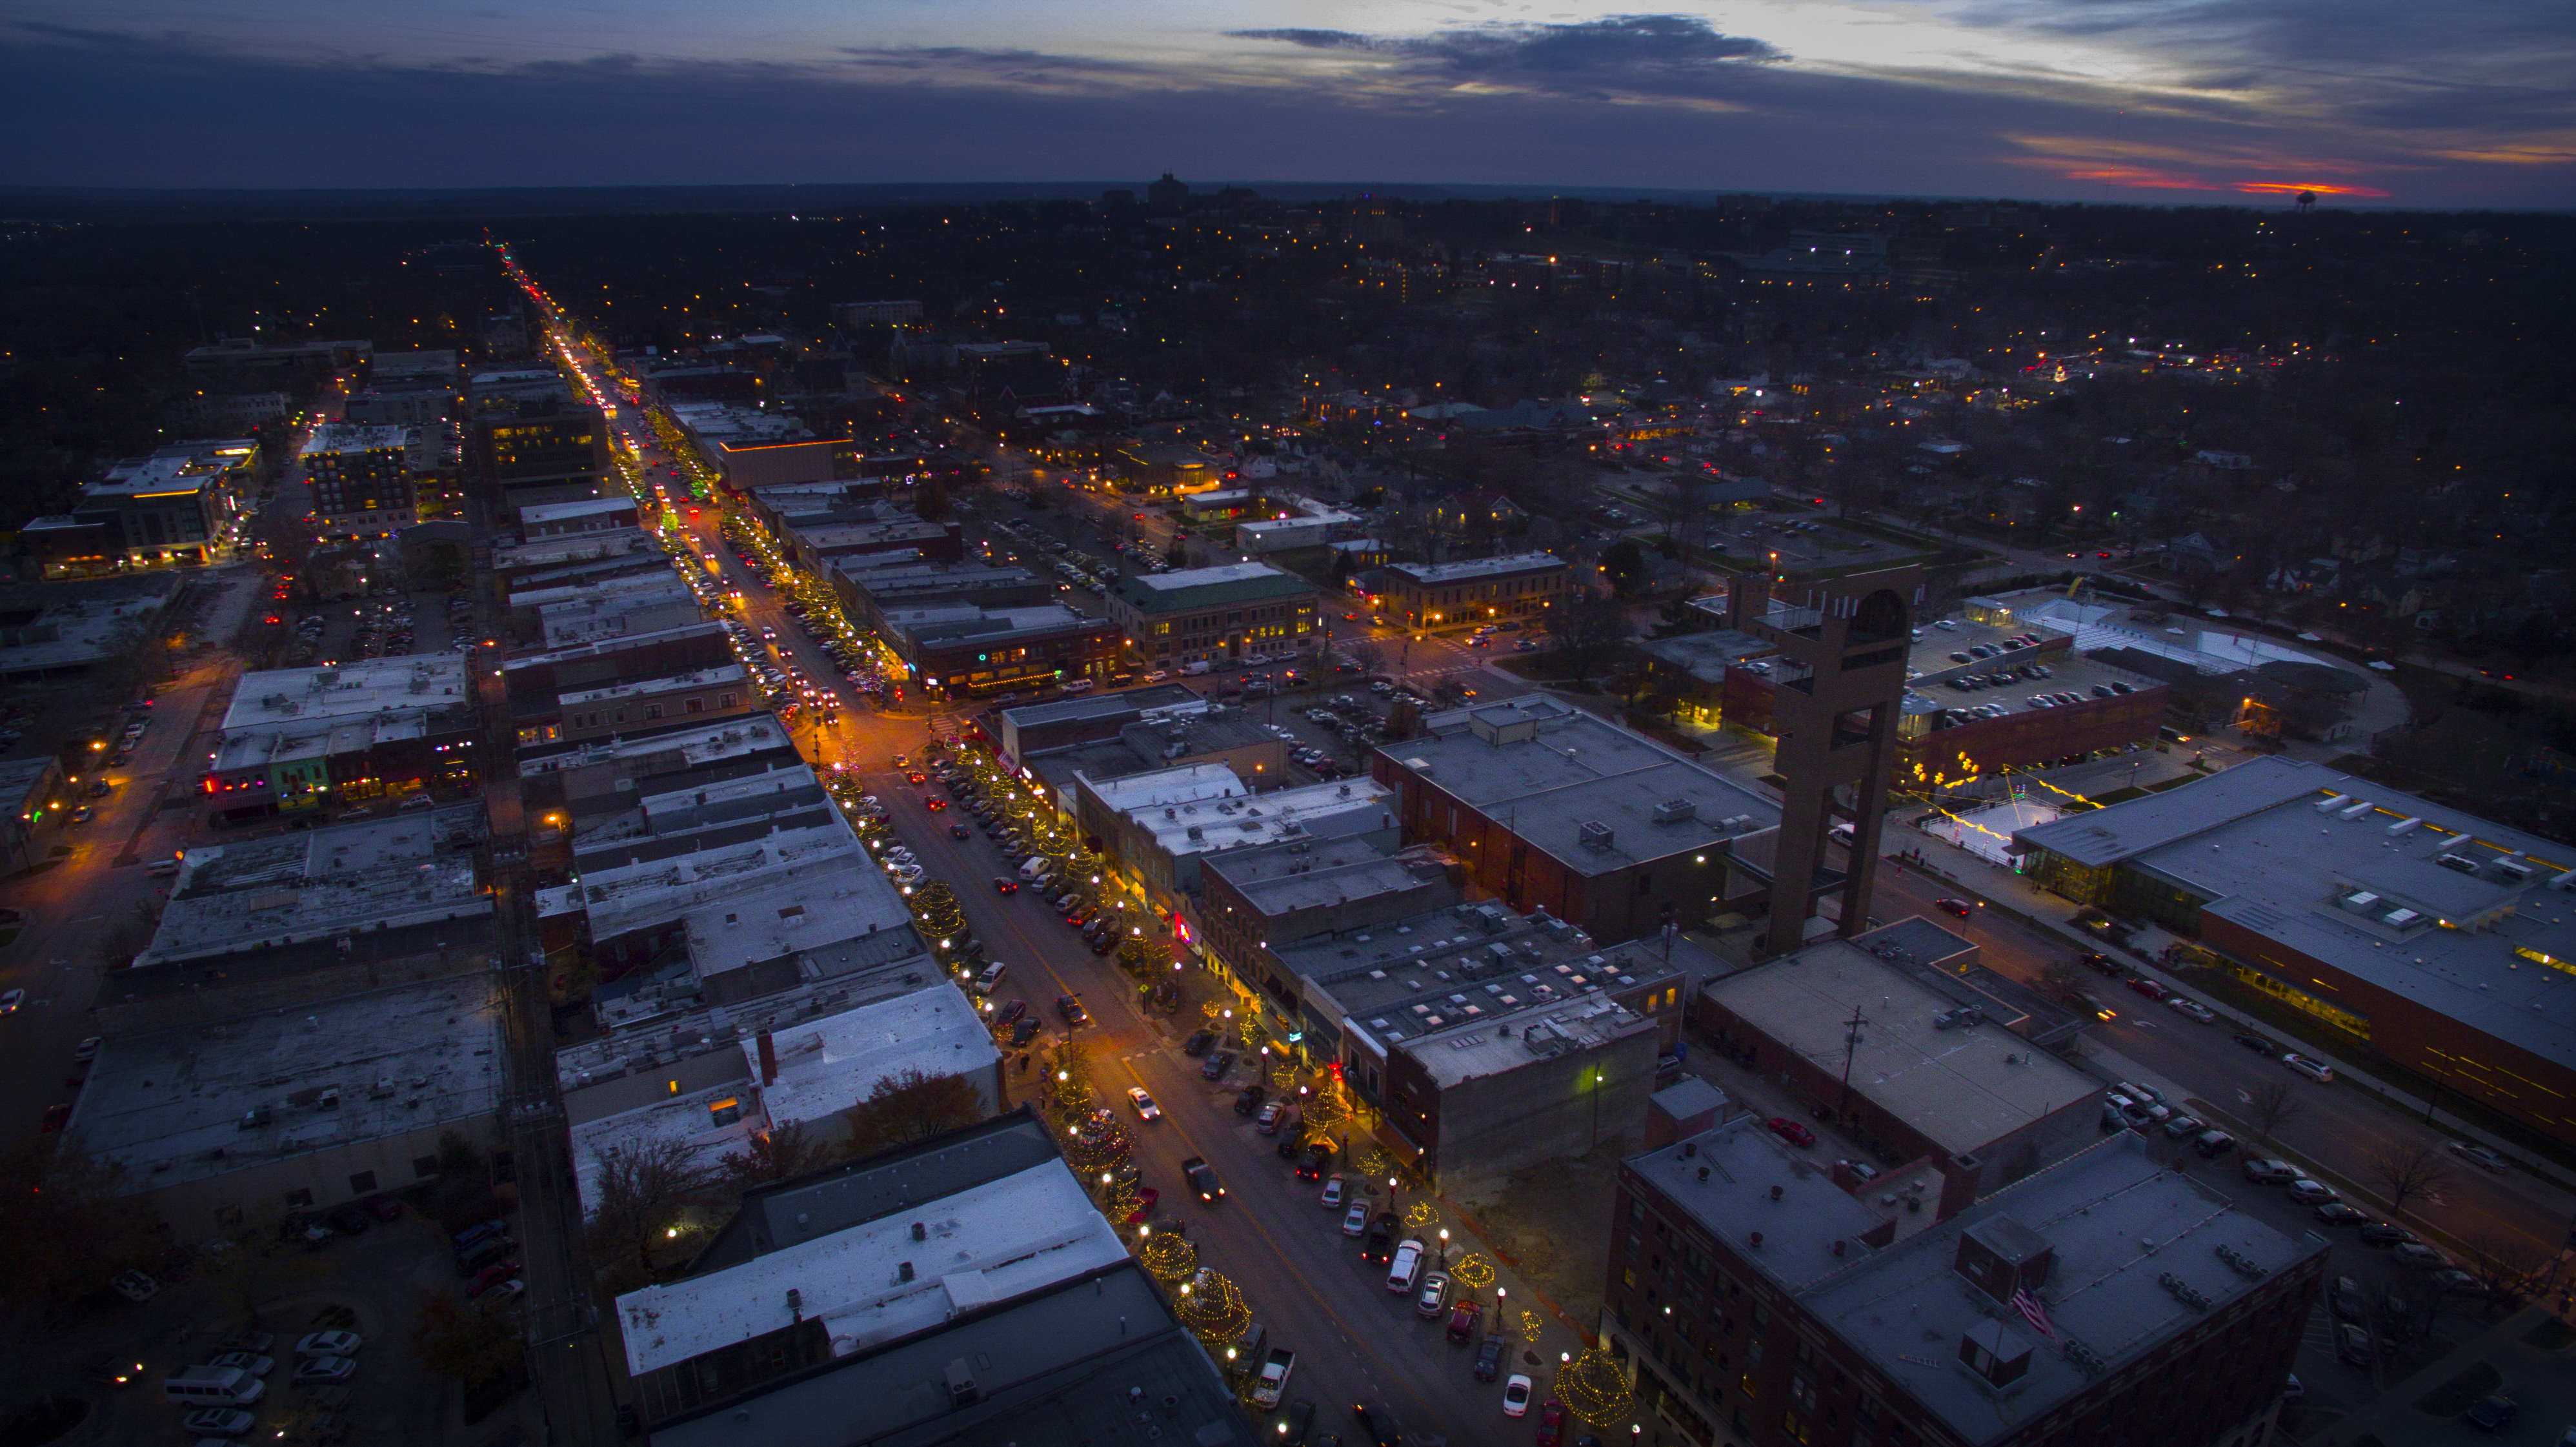
photo by: Nick Krug
As the sun goes down, a combination of lights from street lamps, cars and holiday decorations illuminate Massachusetts Street in downtown Lawrence in this 2015 file photo.
•••
State officials recently released another set of numbers that give a broader view of how well communities are doing in attracting shoppers. In that report, Lawrence doesn’t fare quite as well.
The Kansas Department of Revenue recently released its “Pull Factor” report for cities across the state. The report uses sales tax data to estimate how many outside shoppers are coming into a community. In other words, how much “pull” does a community have to attract shoppers, thus the name of the report.
The finding for Lawrence is that the city has some pull, but not a lot for a city its size, nor for one that is positioned to be a tourist draw due to KU and its various events and attractions.
While that is the finding for 2025, it also has been the finding pretty much every other year the report has been produced. Lawrence routinely is just above the break even point, but only by a few percentage points.
The report comes to its conclusion in a fairly straightforward manner. It records the amount of sales tax collected in the community, then uses the city’s population numbers to calculate the amount of sales tax collected per person. The report then compares the per capita number to the state’s per capital sales tax number.
The thought process is that if you are doing an average job of attracting shoppers from outside your community, your per capita number should match the per capita number for the state as a whole. In that case, the city would receive a score of 1.0, meaning it is average. A city with a score of 1.10 would be 10% above average at attracting outside shoppers. Conversely, a city with a score of 0.90 would be 10% below average.
For fiscal year 2025, Lawrence finished with a score of 1.06. So, while Lawrence was 6% above the state average, that number won’t win Lawrence any awards when compared to the other large retail markets in the state.
Below is the list for the largest retail markets in fiscal year 2025. (The state’s fiscal year runs from July 1 to June 30, if you are scoring at home.)
• Merriam: 5.71
• Salina: 1.52
• Lenexa: 1.49
• Topeka: 1.33
• Manhattan: 1.31
• Overland Park: 1.26
• Olathe: 1.20
• Wichita: 1.13
• Lawrence: 1.06
• Kansas City, Kan.: 0.99
• Shawnee: 0.86
Lawrence was third from the bottom on that list. It is a spot the city is well acquainted with. It is best to look at these pull factor numbers through a long lens. That’s the best way to spot trends. So, below, I’ve pulled the numbers for fiscal years 2020 and 2015. Here’s a look
Fiscal Year 2020
• Merriam: 4.49
• Lenexa: 1.52
• Salina: 1.48
• Topeka: 1.34
• Manhattan: 1.28
• Overland Park: 1.26
• Olathe: 1.21
• Wichita: 1.09
• Lawrence: 1.04
• Shawnee: 0.96
• Kansas City, Kan.: 0.93
Fiscal Year 2015
• Merriam: 4.67
• Lenexa: 1.64
• Salina: 1.49
• Overland Park: 1.42
• Topeka: 1.34
• Manhattan: 1.28
• Olathe: 1.20
• Wichita: 1.10
• Lawrence: 1.07
• Shawnee: 0.96
• Kansas City, Kan.: 0.83
You’ll notice Lawrence’s score has varied by a few percentage points, but it has remained in that third from the bottom spot.
There’s not a lot of movement in the list, as retail markets are big systems that aren’t easy to change quickly. Merriam is glad of that. The town has found the sweetest of spots in the retail world. The city only has about 11,500 residents, but thanks to several big retailers along busy Kansas City trafficways, it produces more sales than much larger communities.
Sometimes, though, the mighty do fall. Overland Park has been falling down the list. A good guess why is that malls have become far less popular. Overland Park is home to Oak Park Mall, and it is not what it used to be. For years, that mall made Overland Park a retail powerhouse in Johnson County. In 2015, it performed 22 percentage points better than Olathe, the Johnson County city closest in population size. Now, Overland Park performs just 6 percentage points better.
Kansas City, Kan. has not been a retail powerhouse at any point in the last decade. Its population doesn’t have as much money as Johnson County’s population, and when KCK residents do spend big, they have a lot of nearby places to shop in Johnson County. However, KCK has invested a lot in building up a tourism and shopping district around the NASCAR race track and the Sporting KC stadium. Since 2015, KCK’s pull factor has improved by 16 percentage points. You have to think that tourism and entertainment district has played a big role in that rise. Now, the big question is what will this number look like in another decade after the Kansas City Chiefs locate their stadium in KCK?
To a lesser degree, Lawrence has a couple of questions of its own that will be interesting to watch over the next decade. What impact will Costco have on Lawrence’s pull factor? It will be the closest Costco store for communities like Topeka and Manhattan, plus tons of smaller communities. That seems like the definition of retail pull.
The second question for Lawrence is what will KU’s conference center do for its retail scene. Remember, in this context, retail doesn’t just mean purchasing goods that you put in a shopping sack. Food and drink sales at bars and restaurants also count. Conference goers normally find time for those activities, and nearly all conference attendees will be from somewhere outside of Lawrence.
It will take some time for answers to emerge, but there are some reasons to watch whether Lawrence may be on the move in this ranking.
Town Talk column
Deal is getting close for luxury hotel to build at 11th and Massachusetts streets; speculation has Graduate by Hilton brand coming to the site
As Costco comes to town, Walmart files plans for convenience store, gas station at its south Iowa store

KU research dollars set a new record in 2025; university conducted more than $600M in research activities

After bringing ax throwing and mini-golf to downtown, business plans to add traditional video game arcade to Mass Street
Despite Costco’s impending arrival, Braum’s says 2026 won’t be the year to build on its Lawrence site; Betty Rae’s ice cream opens on westside