As politicians begin to debate tax changes, a look at how Kansas’ tax rates stack up

photo by: Shutterstock
A welcome sign is pictured along a Kansas highway.
With the release of Gov. Laura Kelly’s recommended budget on Thursday, we are fully in political debate season. No doubt, taxes will be at the center of many debates that take place at the Statehouse between now and its spring adjournment.
Politicians will produce a lot of words in those debates — imagine that — but whether there is a lot of actual data behind the arguments remains to be seen. In that vein, I’m sharing some numbers from a report released earlier this week that tries to ascertain the true, total tax rates for residents of every state.
The report — titled “Who Pays?” — is put out annually by the nonprofit Institute on Taxation and Economic Policy. It is voluminous, and it is so, in part, because it tries to tackle the subject differently than many others. Instead of just focusing on state taxes, for example, it tries to create a broader picture by looking at both state and local taxes. That means property and sales taxes levied by governments like city and county commissions, plus local school taxes, are factored into the rankings.
The simple takeaway from the report is that Kansas is pretty much ranked in the middle of the pack when it comes to how “fairly” states tax their residents.
That doesn’t mean the authors of the report particularly like Kansas’ tax system. The report generally doesn’t like many of the tax systems in the country. It thinks many of the states tax their poorest residents too much and their richest residents too little.
The Institute on Taxation and Economic Policy, while officially nonpartisan, does have a reputation of leaning towards the liberal side of the political spectrum. But the report’s findings suggest the organization isn’t totally one-sided. Several Democratic strongholds, or states that at least lean Democrat, were ranked pretty poorly by the group. For example, in its ranking of states with the highest taxes on low-income households, the Democratic strongholds of Illinois, Hawaii and Washington ranked second-, third- and fourth-worst in the country, while Democrat-leaning Pennsylvania ranked worst.
My point being, I think the group is trying to make some honest assessments versus simply playing politics. I’m mainly interested in the data it gathered in looking at state and local tax rates across the country. The group used the large amount of data culled from statehouses and local appraisers’ offices to come up with an effective tax rate for a variety of state residents.
An effective tax rate basically measures how much you are paying in tax and then compares that to your total income. If you are paying 20% of your income in taxes, you have a 20% effective tax rate.
This report goes a step further and calculates effective tax rates for multiple segments of the population. Specifically, it calculates effective tax rates for residents who are in the lowest 20% from an income standpoint and for people who are in the top 1% from an income standpoint. It also calculates for many levels in between.
Here’s a look at the figures for Kansas. The number in parentheses is the national average.
• Lowest 20%: 11.4% tax rate (11.3%)
• Second 20%: 11.2% (10.4%)
• Middle 20%: 11.7% (10.5%)
• Fourth 20%: 11.2% (10.3%)
• Next 15%: 10.8% (9.5%)
• Next 4%: 9% (8.3%)
• Top 1%: 7.5% (7.2%)
As you can see, the category that could best be described as middle-class has the highest effective tax rate in the state at 11.7%. It is probably worth reminding that the numbers don’t mean a middle-class taxpayer necessarily pays more in total dollars than someone in the top 1%, for instance. Someone paying 7.5% on $1 million is still more than someone paying 12% on $100,000, for instance. How much you care about the percentage amount versus how much you care about the total dollar amount is often a big sticking point between opponents in these tax debates.
It also is worth reminding you that these numbers are just for state and local taxes. Everyone’s effective tax rate would be higher, if we added in what they pay in federal taxes.
But the other takeaway from that list is that Kansas’ effective tax rate is higher than the national average in every income category. Interestingly, the top and the bottom categories are the two that are closest to the national average.
Next, let’s take a look at how Kansas compares to some other states in the region. Here’s a look at how Kansas compares on the rate for the lowest 20% income bracket.
• Arkansas: 13.1%
• Oklahoma: 12.2%
• Iowa: 11.6%
• Kansas 11.4%
• South Dakota: 11.4%
• Nebraska: 11.2%
• North Dakota: 9.8%
• Missouri: 8.4%
• Colorado: 8.3%
Here’s a look at how Kansas compares on the rate for the highest 1% income bracket.
• Kansas: 7.5%
• Nebraska: 7.2%
• Iowa: 7.2%
• Colorado: 7.0%
• Oklahoma: 6.3%
• Arkansas: 5.8%
• Missouri: 5.7%
• North Dakota: 4.9%
• South Dakota: 2.6%
Kansas tops the list there, meaning the state’s richest 1% pay a greater percentage of their income in taxes than rich residents in other states in our region. For the authors of this study, that’s probably a good thing, but it likely won’t be universally viewed that way in the Kansas Legislature.
Something that can get lost in all these numbers, though, is the significant difference between states when it comes to how much they are taxing their residents. For that, here’s a list that shows the highest tax rate for any group in a particular state. In parentheses, I list which income group pays that rate.
• Arkansas: 13.1% (Lowest 20%)
• Oklahoma: 12.2% (Lowest 20%)
• Kansas: 11.7% (Middle 20%)
• Iowa: 11.6% (Lowest 20%)
• South Dakota: 11.4% (Lowest 20%)
• Nebraska: 11.2% (Lowest 20%)
• Colorado: 9.9% (Middle 20%)
• North Dakota: 9.8% (Lowest 20%)
• Missouri: 8.9% (Fourth 20%)
As you can see, Kansas ranks the third highest on that list, but unlike many other states doesn’t charge its highest rate to its lowest-income residents. But the list has the potential to create some questions. For example, is it better to be a state like Kansas that doesn’t have its highest rate levied on its lowest-income group, or are you still better off to be in a system like North Dakota where the lowest-income group pays the highest rate, but that rate is nearly 1.6 percentage points less than what Kansas’ lowest-income residents pay?
That sounds like the makings of a debate. We are in the right season for it.
Town Talk column
Plan for large annexation west of SLT shrinks by more than 300 acres; less land set aside for housing
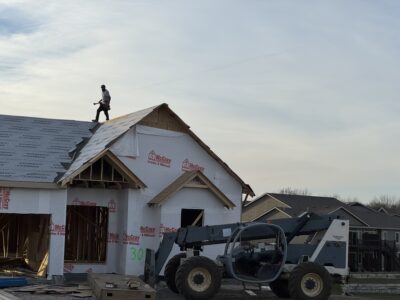
With half the year done, Lawrence again on pace to set record low for single family home construction

Kansas City development company seeking to build $100M worth of housing at KU’s West Campus district

Lawrence home sales down for the year, despite an uptick in number of homes for sale

K.C. company plans to start program for Lawrence residents to recycle food waste, create area compost facility