New Census reports shows Lawrence population grew in 2022, but much slower than city leaders once expected

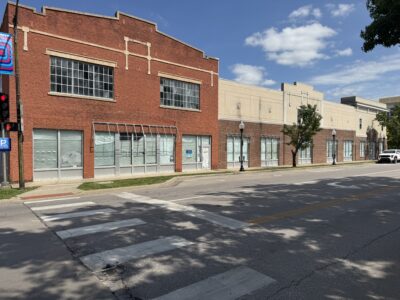
photo by: John English
This aerial photo taken on June 12, 2022, shows Lawrence with the University of Kansas campus in the background.
Pick which set of glasses you want to look through today.
Lawrence is the fourth-fastest growing city in Kansas.
Or, if you prefer, Lawrence is only growing at one-third the rate city leaders expect, and is being outpaced by relatively small communities like Spring Hill, Tonganoxie and Basehor.
Both set of facts are accurate, according to the latest population estimates from the U.S. Census Bureau.
Lawrence in 2022 added 422 people and had a July 1 population of 95,794 people, according to population estimates released by the Census Bureau on Thursday. That gain of 422 people was the fourth-largest numerical gain of any city in the state, trailing the Kansas City-area communities of Olathe, Shawnee and Spring Hill.
If you are a fan of growth, those are about as positive as the numbers get for Lawrence in this year’s report. When you look at Lawrence’s growth rate — the percentage gain in its population increase — the city did not finish near the top of the state’s list.
Lawrence’s one-year growth rate checked in at 0.44%. That growth rate is by no means a negative in Kansas, where any growth is the exception to the rule. According to the latest Census figures, only 152 of the state’s 626 cities posted population growth over the last year.
Many of the those 152 growing cities posted very little growth and are very little cities. There are many that may have added two or three people in total to land in the category of towns that grew.
When diving into the numbers deeper, there were only 15 cities that added 100 or more people in the last year. Of that group, Lawrence’s growth rate was 14th out of 15. Here’s a look, with their percentage growth rates and the number of people they added:
• Spring Hill: 7.92% (678)
• Maize: 6.4% (385)
• Bel Aire: 4.39% (371)
• Basehor: 3.97% (288)
• Mulvane: 3.33% (218)
• Goddard: 3.27% (176)
• Park City: 2.32% (196)
• Shawnee: 2.26% (1,531)
• Tonganoxie: 2.13% (122)
• Andover: 1.62% (249)
• Olathe: 1.53% (2,189)
• Gardner: 0.87% (208)
• Derby: 0.63% (162)
• Lawrence: 0.44% (422)
• Overland Park: 0.07% (129)
Perhaps the more important point in all of this is how Lawrence’s growth rate compares to what City Hall leaders are expecting. Last August, the city’s planning department put together its own population estimates for Lawrence. Those estimates concluded a reasonable estimate of the city’s growth rate for the foreseeable future was 1.2% per year. At 0.4%, the Census Bureau has Lawrence’s estimated growth rate coming in at about one-third of the city’s number.
Growth rate predictions are important because they form the foundation for many planning decisions, including how big to build water and sewer plants, which are decisions that are measured in the tens of millions of dollars.
The differences between the Census and the city don’t stop with growth rates, though. The city and the Census officially disagree about how many people live in Lawrence. This is not a new issue. In fact, I’ve been writing about it periodically for more than 20 years.
The city challenged the Census Bureau’s 2010 population count (not the estimate but the actual Census count). The city contends the Census didn’t have an accurate understanding of the number of living units in the city, and its population count came in too low as a result. The Census Bureau disagreed.
The result is that Lawrence keeps its own population estimate and it is growing more and more out of touch with the Census’ official population numbers all the time. Last August, Lawrence City Hall estimated the July 1, 2022, population of the city to be 105,295. The Census numbers released Thursday have Lawrence at 95,794. In other words, Lawrence City Hall believes the city’s population is 10% greater than what the Census Bureau believes.
That’s a material difference in and of itself. But it becomes even more significant as time passes, especially when you factor in the difference in the growth rate of what the Census is seeing versus what Lawrence leaders expect.
With a 1.2% growth rate and a current population that Lawrence officials believe is about 105,000, the city will top the 115,000 population mark in about 2030, according to the city’ estimates. That is what the city is planning for when it makes a host of decisions.
But what if the Census Bureau is right? How long would it take for Lawrence to reach 115,000 people if you use the Census Bureau’s population estimate and its most recent growth rate for the city? That would be in the year 2064 — a whopping 34 years later than what the city’s estimates predict. Obviously, that is a huge difference when you are trying to figure out when to build a water plant, a sewer plant or a whole lot of other costly items.
At some point, I would think the officials who are making those costly decisions would rest more comfortably if the city and the Census were more closely in agreement.
But for today, and for decades now, they have not been. Here’s a look at some other numbers from the latest Census report, starting with population estimates for area towns.
• Baldwin City: 4,906 people, up 9 or 0.18%
• De Soto: 6,478 people, up 86 or 1.35%
• Eudora: 6,426 people, down 20, or -0.31%
• Leavenworth: 37,081, down 80 or 0.22%
• Lecompton: 591, down 3, or -0.51%
• Ottawa: 12,613 down 30, or 0.24%
Here’s a look at the 10 cities that had the largest population declines, measured in actual number of people:
• Kansas City: -1,444
• Topeka: -675
• Manhattan: -577
• Wichita: -487
• Liberal: -360
• Garden City: -317
• Salina: -273
• Junction City: -267
• Dodge City: -227
• Ulysses: -101
Finally, here are the 10 cities of at least 5,000 population that had the largest population measured by percent decline. The second number shows the actual loss in number of people.
• Liberal: -1.83% (-360)
• Ulysses: -1.75% (-101)
• Pratt: -1.21% (-80)
• Junction City: -1.19% (-267)
• Garden City: -1.14% (-317)
• Chanute: -1.10% (-95)
• Manhattan: -1.06% (-577)
• Bonner Springs: -1.03% (-80)
• Kansas City: -0.93% (-1,444)
• Parsons: -0.92% (-87)
Town Talk column
Plan for large annexation west of SLT shrinks by more than 300 acres; less land set aside for housing
With half the year done, Lawrence again on pace to set record low for single family home construction
Kansas City development company seeking to build $100M worth of housing at KU’s West Campus district

Lawrence home sales down for the year, despite an uptick in number of homes for sale

K.C. company plans to start program for Lawrence residents to recycle food waste, create area compost facility