New report shows Lawrence, like most cities in the state, ranks below average for racial, ethnic diversity

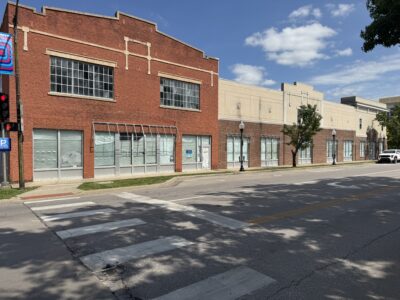
photo by: John English
This aerial photo taken on June 12, 2022, shows Lawrence with the University of Kansas campus in the background.
Somehow, our next-door neighbor Kansas City, Kansas, has become the regional hub for both NASCAR and professional soccer. (You’ve got your next reality TV hit if you combine those two tailgate parties.) But a new national ranking suggests that such diversity may be spot on: Kansas City, Kansas, is the most ethnically diverse city in the region, and the competition isn’t particularly close.
Lawrence — and nearly every other city in the state — ranks far behind KCK in a new ranking of the most and least ethnically diverse cities in the U.S. While KCK was the 55th most ethnically diverse city in the country, Lawrence ranked No. 304 out of the 501 cities in the report.
The ranking is put together by the financial services firm WalletHub. The online firm can have some wacky rankings, but this one appears pretty straightforward. The firm looked at Census data for 501 U.S. cities. The ranking focused on three metrics: 1. The ethnic make-up of a city, such as white, Black, Hispanic, Asian, American Indian or other ethnicities; 2. The primary languages spoken in each city; 3. The concentration of how many residents of a city were born in that city’s state versus other areas of the country or in foreign countries.
One thing to remember, the ranking measures how great of a mix there is of ethnicities or races in a community. It is not simply trying to measure which cities have the highest concentration of non-white population. A community that has a population of 80% Black residents would score the same as a community that has a population of 80% white residents, for example.
With those explanations out of the way, here’s a look at the rankings of Lawrence and some regional communities. Lawrence ranked No. 304, just above Toledo, Ohio, and just below Woodbury, Minnesota. The report provides subrankings for each community, based on the three categories I listed above. Lawrence had its lowest ranking in the ethnic-racial diversity category, finishing No. 324 out of 501. It had its best ranking in the birthplace diversity category, ranking No. 160. It’s language diversity finished at No. 271.
Here’s a look at the overall ranking for communities in the region:
• No. 55: Kansas City, Kansas
• No. 119: Oklahoma City
• No. 125 Tulsa, Oklahoma
• No. 181: Kansas City, Missouri
• No. 196: Wichita
• No. 203: Des Moines, Iowa
• No. 221: Omaha, Nebraska
• No. 224: Colorado Spring, Colorado
• No. 239: St. Louis
• No. 259: Iowa City, Iowa
• No 284: Overland Park
• No 287: Norman, Oklahoma
• No. 300: Topeka
• No 304: Lawrence
• No. 319: Stillwater, Oklahoma
• No. 320: Ames, Iowa
• No. 328: Columbia, Missouri
• No. 339: Manhattan
• No. 345: Fort Collins, Colorado
• No. 356: Lenexa
• No. 368: Lincoln, Nebraska
• No. 380: Independence, Missouri
• No. 386: Shawnee
• No. 397: Salina
• No 407: Lee’s Summit, Missouri
• No. 422: St. Joseph, Missouri
• No. 445: Springfield, Missouri
The list serves as a reminder of some themes that shouldn’t be too surprising for people who have been watching Lawrence for a number of years. Lawrence is not a very racially diverse place, and that is the case in many Kansas communities. The list indicates it is the case in much of middle America. Of the top 50 cities nationally, only 12 of them weren’t on either the East or West Coast.
The list also shows university communities — despite being places generally thought to highly value diversity — often aren’t very diverse places from a racial or ethnic standpoint. New Haven, Connecticut — home to Yale — ranked No. 31 in the report, but it was the only real college community in the top 50.
It looks like the last time I wrote about this particular report was in 2018, and the results haven’t changed much. Lawrence was No. 329 out of 501 back then, although the methodology changed slightly, so it is hard to make absolute comparisons.
What is easier to compare are Census numbers. Since demographic trends in a community change slowly, I was curious how much Lawrence has changed over the last 50 years. I dug up Census data from the 1970 Census. The only numbers I could find readily available were at the county level. Because of changes in categories from 1970 to 2020, I only felt comfortable comparing numbers for the Black population. The numbers are an imperfect measurement for changes in racial diversity, but are interesting nonetheless. All five of the largest counties of Kansas have seen their percentage of the Black population increase over the last 50 years.
All but one of the counties have grown at about the same pace — a range from just less to just more than one percentage point — since 1970. The one exception is Johnson County, which overall has been the fastest growing of all the counties. It has seen its racial make-up change dramatically over the last 50 years. That doesn’t mean that it has a lot of racial diversity today, but instead the numbers show it was incredibly nondiverse when it came to race in 1970. I had to double-check the numbers, in fact, but the 1970 Census report showed that Johnson County had just 1,031 Black residents in a county of nearly 220,000 people. The Black population made up just 0.4% of the entire population. Today, it comprises 4.7% of the population.
That is by far the biggest jump of Kansas’ large counties. Still, even with that growth, Johnson County has the second lowest percentage of Black residents of the five largest counties in the state. Douglas County has the lowest percentage. Here’s a look at the numbers:
• Douglas County: 3.6% Black population in 1970; 4.4% Black population in 2020.
• Johnson County: 0.4% Black population in 1970; 4.7% Black population in 2020.
• Sedgwick County: 7.9% Black population in 1970; 8.8% Black population in 2020.
• Shawnee County: 7.2% Black population in 1970; 7.9% Black population in 2020
• Wyandotte County: 19.1% Black population in 1970; 20.4% Black population in 2020
Town Talk column
Plan for large annexation west of SLT shrinks by more than 300 acres; less land set aside for housing
With half the year done, Lawrence again on pace to set record low for single family home construction
Kansas City development company seeking to build $100M worth of housing at KU’s West Campus district

Lawrence home sales down for the year, despite an uptick in number of homes for sale

K.C. company plans to start program for Lawrence residents to recycle food waste, create area compost facility