Lawrence taxes versus those in other cities: We’re a bottom three community, by one measure

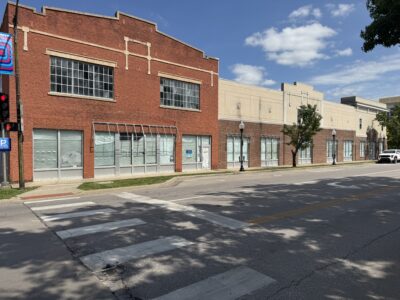
photo by: Nick Krug/Journal-World Photo
Downtown Lawrence is pictured in this aerial photo from December 2017.
In Lawrence, there is always a lot of focus on the quest to get to the Final Four. But there are other numerical accomplishments we could focus on too. How about the Last Three?
Don’t clear out a space in the trophy case just yet. We’re talking about taxes, and being in the last three is far from a championship showing.
Every few years, I compare Lawrence’s tax rates to those of other large cities in the state. The League of Kansas Municipalities does the bulk of the work by putting out a data book that lists the total property tax mill levy of every city in the state. That means, city, county, state and school district taxes combined. I then use some data from the Census Bureau and the Kansas Department of Revenue to add to the analysis.
So, what are the results? By one metric, Lawrence is a bottom-three community in the state when it comes to combined property tax and sales tax burden. The city doesn’t have the highest of property tax rates, and doesn’t have the highest of home values, which definitely plays into how much you pay in property taxes. It also doesn’t have the highest of sales tax rates.
So, at first glance, Lawrence would be an unlikely candidate to land in the bottom three in the state. But when you add average incomes into the mix, the picture begins to change. Lawrence, perhaps surprisingly to some, doesn’t have the lowest average incomes of the 15 large communities I examined. (I looked at every city with a population of 25,000 or more.) There are several places that have average incomes that are lower. But most of those communities also have home prices that are far lower than Lawrence’s. That’s long been the rub in Lawrence: Its income levels don’t match up well with its home prices.
To top it off, many of the communities that have lower incomes than Lawrence also have lower sales tax rates.
Add it all up, and it is an equation to land in the Last Three.
I’ll get to the list that shows that at the end of this article, but before we get there, let me walk you through some of the key data and rankings that lead up to the big-picture analysis.
Property tax mill levies
As a reminder, a mill levy is the property tax rate set by local governments. It is only half of the equation in determining your property tax bill. The value of your home is the other half.
Highest mill levy: Dodge City: 182.368 mills
Lowest mill levy: Overland Park: 111.893 mills
Median mill levy: 134.44 mills
Lawrence mill levy: 134.44 mills (eighth highest of 15)
Notes: When I did the same calculation in 2014, Lawrence had the 11th highest out of 16 communities. (Junction City has fallen off the list due to a drop in population below 25,000 people.)
Median home value
These numbers are from the U.S. Census’ American Community survey project. They show the median value of all homes in a community.
Lowest home value: Kansas City: $95,600
Highest home value: Leawood: $463,200
Median home value: $149,300
Lawrence home value: $195,500 (seventh highest of 15)
Notes: There is some misconception that Lawrence has the highest home values of any big city in the state. That’s not true. In addition to Leawood, the other cities with higher home values than Lawrence are: Overland Park, Lenexa, Olathe, Shawnee, and Manhattan.)
Incomes
Taxes are kind of a relative thing. They can be burdensome or little noticed, depending on how much money you have. Incomes can be tricky to measure in Lawrence because there are so many college students who really aren’t earning an income. Scholarships and other outside funding pays for them to go to school, but that doesn’t count as income, and thus it artificially deflates the average income for all of Lawrence. I try to work around that by using a census statistic that measures the median income of residents who are employed 40 hours per week. That takes a lot of students out of the mix and gets us closer to apples to apples with other communities.
Lowest income: Dodge City: $35,887
Highest income: Leawood: $114,932
Median income: $42,752
Lawrence: $44,929 (fifth highest of 15)
Notes: It may surprise some people that Lawrence’s median income is actually slightly above the median for the entire group of 15 cities. Specifically, it is $2,177, or 5%, above the median income. However, don’t forget the statistics from above. Lawrence’s average home price is $46,200, or nearly 31%, above the median. Incomes that are 5% above average; home prices that are 30% above average. That’s an equation that plagues Lawrence.
Property taxes vs. income
This is a fairly simple concept. I create a hypothetical homeowner who owns the average home and makes the average income in each community. I calculate the property taxes due in each community. Then, I compare how great of a bite that property tax bill takes out of that annual income. Don’t get too hung up on the percentage. Many households have two incomes to help pay for the tax bill. This doesn’t factor that in. Rather, this is just a way to rank the communities and see how far above or below average Lawrence stands.
Highest: Manhattan: 8.76% of income goes to property taxes
Lowest: Wichita: 4.27% of income goes to property taxes
Median: 5.6% of income goes to property taxes
Lawrence: 6.73% (third highest of 15)
Notes: Garden City was the other community, besides Manhattan, that ranked higher than Lawrence. Our hypothetical homeowner in Garden City pays 7.14% of income toward property taxes.
Sales tax rate
This one is simple. Every community charges a sales tax rate on goods purchased. This just ranks the rates. Many communities, including Lawrence, have special sales tax districts that charge an extra rate to help support a particular development. This doesn’t measure those rates. It looks only at the citywide sales tax rate for each community.
Highest: Shawnee: 9.6%
Lowest: Wichita: 7.5%
Median: 9.125%
Lawrence: 9.3% (fifth highest of 15)
Notes: Back in 2014, Lawrence was the eighth highest out of 16. Of the communities that have higher sales tax rates — Shawnee, Olathe, Lenexa and Leavenworth — all but one are in Johnson County.
Property taxes plus sales taxes
This is where Lawrence gains its spot in the Last Three. It also is a little more complicated of a measurement. Remember that property taxes vs. income category above? I take those percentages for each community and add those to the sales tax rate for each community. That creates a score for each community, which gives you a sense of the combined property tax and sales tax environment for each city. Don’t get too hung up on the score. For example, even though it is two percentages added together, it does not show you the percentage of income an average person spends on property and sales taxes in each community. To know that number, I would need to know the average amount of taxable goods an average person buys in each community. I don’t have that number. Rather, these scores are just a way to rank the communities and see how far above or below average Lawrence stands. A lower score represents a less burdensome tax rate environment. Here’s the complete list:
1. Wichita: 11.77
2. Hutchinson: 13.70
3. Topeka: 13.73
4. Leavenworth: 13.83
5. Kansas City: 14.12
6. Salina: 14.37
7. Overland Park: 14.68
8. Leawood: 14.73
9. Dodge City: 15.03
10. Shawnee: 15.20
11. Lenexa: 15.71
12. Olathe: 15.86
13. Lawrence: 16.03
14. Garden City: 16.09
15. Manhattan: 17.71
So, that’s the big picture. Or, is it? Anyone who knows Kansas knows those 15 communities are really different. I’m not sure the excitement level to live in each of those cities is equal. In fact, I know it is not. I also know that not all of them have the same prospects for the future. Some of them have population growth, some of them have population declines, and some are treading water. Lawrence, in case you are wondering, had the third-fastest population growth, behind Lenexa and Overland Park, respectively. That surely says something about desirability.
Whenever I do this tax analysis, I think it is important to note that taxes aren’t the only things that matter in a community. Fortunately, we each get to make our own decisions about what matters most.
But, the beads aren’t yet smoking on my abacus, so I’ll do one last set of calculations. I looked at the population growth rate for each community from 2010 to 2019. I ranked the cities 1 through 15 on that metric. I took that ranking and added it to the rank in the list above. Theoretically, this will show us a list of communities that have the best combination of tax environment and population growth rates, if that’s important to you. In this case, the lower the number, the more favorable the score.
• Overland Park: 9
• Wichita: 11
• Lenexa: 12
• Kansas City: 12
• Leavenworth: 13
• Leawood: 13
• Olathe: 16
• Topeka: 16
• Lawrence: 16
• Shawnee: 16
• Hutchinson: 17
• Dodge City: 20
• Salina: 20
• Manhattan: 23
• Garden City: 26
As you can see, Lawrence is in the middle of the pack on that ranking, almost entirely due to its tax environment. Middle of the pack isn’t likely something to hang a banner for, but it sure does sound better than the Last Three.
Town Talk column
Plan for large annexation west of SLT shrinks by more than 300 acres; less land set aside for housing
With half the year done, Lawrence again on pace to set record low for single family home construction
Kansas City development company seeking to build $100M worth of housing at KU’s West Campus district

Lawrence home sales down for the year, despite an uptick in number of homes for sale

K.C. company plans to start program for Lawrence residents to recycle food waste, create area compost facility