As students returned to school, local sales tax numbers not as bad as once feared

photo by: Nick Krug
A cashier hands a receipt back to a customer after a purchase at Lawrence's Sunflower Outdoor and Bike Shop in this file photo from July 6, 2017.
Personally, I don’t think roller coasters and the year 2020 mix well. (After all, there is a lot of screaming and little social distancing, which makes it only slightly less dangerous than Thanksgiving dinner.) But the state’s retail economy seems to be on such an up-and-down ride.
Each month, I report on the sales tax collections for 10 of the largest retail centers in the state. Last month’s report, which basically covered sales made in July, showed those communities experienced an average decline of just more than 10% compared with the same period a year ago.
This month’s report, which basically covers sales made in August, shows that, despite the pandemic, sales tax collections actually increased by about 3.5% from the same period a year ago. Think about it: The numbers show we spent more money in pandemic August than we spent in nonpandemic August a year ago. (I guess parents were buying a lot of bubble wrap to outfit their kids for school each day.)
Lawrence was on the same type of ride, but our roller coaster does spend more time going down than up. Last month’s report showed a loss of 12.4%, while this month’s report showed a loss of 0.1%. Obviously, that is a big improvement, but it also isn’t nearly as big of a bounce as many of the state’s retail centers experienced. The next couple of lists will show that Lawrence is lagging the state in general. This list shows sales tax collections for the month:
Olathe: up 7.9%
Salina: up 7.7%
Sedgwick County: up 6.2%
Topeka: up 4.0%
Lenexa: up 3.8%
Shawnee: up 3.0%
Kansas City: up 2.4%
Overland Park: up 0.8%
Lawrence: down 0.1%
Manhattan: down 1.1%
The two university communities were hit the hardest in the month, but I think people would have said your mask is cutting off your brain’s circulation if you would have predicted that Lawrence — during the back-to-school month of August — basically would have put up numbers equal to a normal August. In other words, Lawrence isn’t going to complain too loudly about being down by that amount, but it would have been nice to see a bump like Topeka, Olathe or Sedgwick County, which is basically Wichita.
The next list shows how communities are doing year to date, with 10 of the 12 monthly reports now in the books. Since the pandemic began, Lawrence has been near the bottom of this list, and continues to be so.
Lenexa: up 2.4%
Sedgwick County: up 1.0%
Topeka: up 0.9%
Olathe: up 0.5%
Salina: up 0.5%
Shawnee: down 0.5%
Manhattan: down 2.9%
Kansas City: down 3.0%
Lawrence: down 3.7%
Overland Park: down 7.0%
The Lawrence numbers are a drag, but at least we aren’t Overland Park. That Johnson County community was showing signs of stress before the pandemic, and it has continued since. I’m sure Overland Park leaders are working on trying to fix those numbers, but at some point it could become a broader concern. Like it or not, Overland Park is a significant driver of the state’s economy.
As we have been reporting for months, though, Lawrence is seeing an uptick in one other type of sales tax collection. Lawrence’s use tax, a special sales tax charged mainly on purchases made by Lawrence residents from an online retailer outside of Lawrence, have been consistently up.
In the latest report, they were way up. The latest numbers show a 17% increase for the month, compared with the same period a year ago. For the year to date, Lawrence’s use tax collections are up 8.2%, or a little more than $200,000, compared with the same period a year ago.
That is a trend, however, that is not unique to Lawrence. At some point, I will look at how other cities in the state are doing on that front. But right now, I simply pulled the statewide numbers. The overall use tax collections in the state are up by 18% for the year, compared with the same period a year ago. That has resulted in about $26 million in new tax revenues for local cities and counties.
This internet thing may be here to stay.
Town Talk column
Plan for large annexation west of SLT shrinks by more than 300 acres; less land set aside for housing
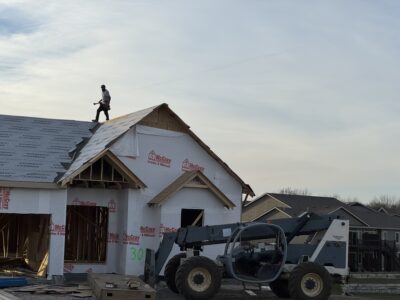
With half the year done, Lawrence again on pace to set record low for single family home construction
Kansas City development company seeking to build $100M worth of housing at KU’s West Campus district

Lawrence home sales down for the year, despite an uptick in number of homes for sale

K.C. company plans to start program for Lawrence residents to recycle food waste, create area compost facility