A look at how much money area residents were making in 2019; Lawrence income growth was slow
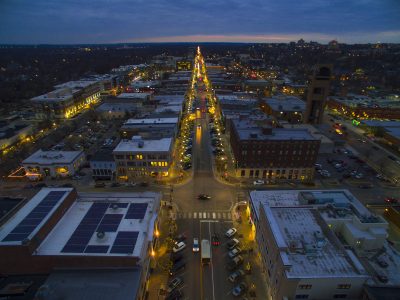
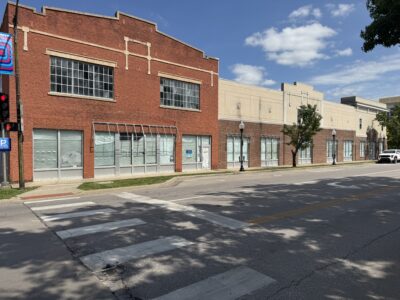
photo by: Nick Krug
Massachusetts Street is illuminated by holiday lights and vehicles on Thursday, Dec. 14, 2017.
Even before the pandemic, a part of the Lawrence economy was ailing — county residents were seeing their incomes grow at one of the slowest rates in the state.
New federal numbers released Tuesday show that income growth in Douglas County ranked 101st out of the 105 counties in Kansas in 2019. Yes, you remember 2019, a time when masks were for bank robbers and toilet paper supplies weren’t a leading cause of hypertension. In other words, these 2019 numbers aren’t affected by the massive slowdown we experienced due to pandemic-related restrictions. Those income numbers are still a year away.
Rather, something else was creating a drag on the money stream in Lawrence during 2019. I don’t know what it was, as my efforts to locate a money stream usually leave me up a certain type of creek without a paddle. Regardless, the U.S. Bureau of Economic Analysis reports Douglas County’s personal per capital income increased by 2.8% to $45,163 in 2019. Statewide per capita income grew by 4.2%; nationally, metropolitan areas posted a 3.4% increase. So, Douglas County was a bit behind.
But we were in good company. Johnson County had even slower growth at 2.3%, which ranked it 103rd out of 105 counties. Some of the state’s other large counties also posted some of the slower growth rates. Honestly, it is hard to remember what was going on in 2019, but the trends were favoring rural areas in the state. Whether it was agriculture prices or additional fracking activity or some other factor, smaller counties posted some big numbers.
In fact, Kansas’ Sheridan County had the highest growth rate in the entire country. Per capita personal income increased 34.7% in 2019. If you are trying to remember the last time you were in Sheridan County, think of all the fun times in the northwest Kansas community of Hoxie, which is the county seat. Incomes there increased from $46,000 in 2018 to $62,000 in 2019. (You aren’t laughing now, are you?)
Most of Kansas’ larger counties came nowhere close to those types of growth numbers. Here’s a look:
• Johnson County: up 2.3% to $76,206
• Sedgwick County: up 3.0% to $53,577
• Wyandotte County: up 3.3% to $34,518
• Shawnee County: up 2.2% to $47,991
• Douglas County: up 2.8% to $45,163
• Riley County: up 3.7% to $42,528
If you are interested in some of our smaller, neighboring counties, here’s a look at those figures:
• Franklin: up 4.2% to $44,472
• Jefferson: up 3.5% to to $46,234
• Leavenworth: up 3.4% to $44,075
• Osage: up 3.9% to $43,460
What might be helpful is a little perspective. The statewide average per capita personal income is $53,426, so Douglas County is about 15% below the statewide average. Perhaps also helpful is a more precise definition of what per capita personal income includes. It basically is the measure of all income that individuals — not businesses — receive. That’s everything from paychecks to Social Security checks to investment income. But don’t confuse this number as an “average salary” for county residents. It is not. These numbers are for every man, woman and child in the county. But the numbers do give an idea of relative wealth of individuals in a county.
Because this figure basically is just all the income in the county divided by the total population, low population counties with big farming operations often show up with some of the best figures in this report, even though those counties have plenty of other economic challenges they are dealing with.
For that reason, it probably is wiser to compare Lawrence with some other similar communities. Here’s a look at how Douglas County’s per capita personal income numbers compare with the metro areas of some other college communities in the region.
• Boulder (University of Colorado): up 4.1% to $76,527
• Austin (University of Texas): up 3.9% to $61,977
• Iowa City (University of Iowa): up 1.9% to $55,834
• Fort Collins (Colorado State): up 3.1% to $55,884
• Lincoln (University of Nebraska): up 2.6% to $50,833
• Columbia (University of Missouri): up 4.3% to $47,482
• Manhattan (Kansas State): up 4.2% to $47,072
• Lawrence (KU): up 2.8% to $45,163
• Morgantown (University of West Virginia): up 2.8% to $44,458
• Ames: (Iowa State): up 2.7% to $44,952
• Waco (Baylor University): up 1.8% to $41,723
Another thing to remember about per capita personal income numbers is that because they measure incomes for all residents, college communities can show up a little bit lower than average because university students aren’t necessarily bringing in a lot of income during their education. That’s a comment some Lawrence leaders make when presented with these types of numbers. But I did wonder how much of a factor that is in other university communities. So this list shows how far a community’s per capita income is above or below the statewide average:
• Boulder: $76,527; 25% above statewide average
• Austin: $61,977; 17.3% above statewide average
• Iowa City: $55,834; 7.6% above statewide average
• Morgantown: $44,458; 5% above statewide average
• Columbia: $47,482 2.4% below statewide average
• Lincoln: $50,833; 6.7% below statewide average
• Fort Collins: $55,884; 8.6% below statewide average
• Manhattan: $47,072; 11.1% below statewide average
• Ames: $44,952; 13.3% below statewide average
• Lawrence: $45,163; 14.9% below statewide average
• Waco: $41,723; 20.9% below statewide average
Town Talk column
Plan for large annexation west of SLT shrinks by more than 300 acres; less land set aside for housing
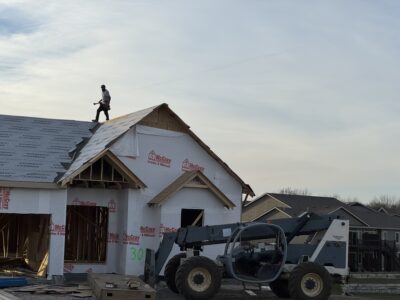
With half the year done, Lawrence again on pace to set record low for single family home construction
Kansas City development company seeking to build $100M worth of housing at KU’s West Campus district

Lawrence home sales down for the year, despite an uptick in number of homes for sale

K.C. company plans to start program for Lawrence residents to recycle food waste, create area compost facility