New numbers show Lawrence’s wages, plus cost of living have it at bottom of statewide list in 2019

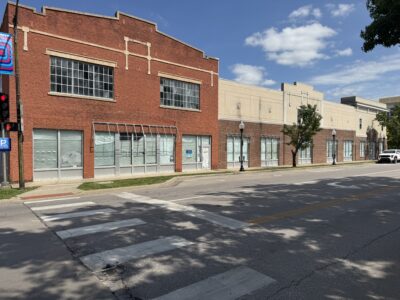
photo by: Nick Krug/Journal-World Photo
Downtown Lawrence is pictured in this aerial photo from December 2017.
It would be inaccurate to say there is not a dime’s worth of difference between living in Lawrence and Joplin, Mo. One is home to a major university and in a growing corridor just minutes away from somewhat cosmopolitan Kansas City. The other is in an isolated area of southwest Missouri and may be best known for fighting back from a devastating 2011 tornado.
But it would be accurate to say there is not $10 worth of difference between living in the two cities. At least that’s what new federal numbers on income levels show.
The U.S. Bureau of Economic Analysis this week released its per capita income figures for every metro area in the country for 2019. In some ways, this is one of the easiest government figures to understand. It measures how much people get paid in wages, Social Security checks, stock dividends, rents from properties they own, and all the other normal ways that people collect money for their bank accounts.
But federal officials also do something pretty interesting with the numbers. They adjust the dollar amounts based on how much you pay for a basket of goods and services, and they don’t use some broad national average of prices. They use prices from each metro area.
With wages that are below average and cost-of-living that is above average (compared to other cities in the area,) it is an equation that doesn’t produce a pretty answer for Lawrence. It is the equation that produced numbers showing Lawrence and Joplin as almost identical.
The Bureau of Economic Analysis figures show that per capita personal income in the Joplin metro was $41,423 in 2019 while it was $45,163 in the Lawrence metro. That’s a big enough difference that paychecks in those two metros almost certainly do look different. But when the price differences in the two regions are factored in, the buying power of Joplin’s personal income increases to $45,521 while Lawrence’s only grows to $45,530 — a difference of $9 between two otherwise very different communities.
The Joplin numbers, of course, are just one narrow example I used to get your attention. A broader and probably more meaningful statement is that Lawrence has the lowest per capita personal income numbers of any metro area in Kansas, no matter how you measure it. The list below shows first the per capita number adjusted for inflation and cost-of-living. It then shows the growth rate since 2018. The number in parenthesis is the unadjusted per capita personal income figure.
• Wichita: $54,460, up 2.6% ($52,129)
• Kansas City, Mo.-Kan.: $54,443, up 1.3% ($55,009)
• Topeka: $49,580, up 1.8% ($47,418)
• Manhattan: $47,764, up 3.6% ($47,072)
• Lawrence: $45,530, up 2.0% ($45,163)
The list above shows that Lawrence wages generally don’t measure up to other metro areas, as the unadjusted numbers are about $2,000 behind any of the other metros, at a minimum. And when you dive into the living costs of each metro, you find that Lawrence has the second highest total of any metro in the state, and specifically has housing prices that are almost 15% higher than some Kansas metros. That’s how an approximately $2,000 wage gap between Topeka and Lawrence turns into about a $4,000 cost-of-living gap.
Below is a list that shows some cost-of-living figures from the BEA report. The numbers show how much above or below a community’s cost of living is compared with the national average. So, Lawrence’s overall score of 91.1 means its total cost of living is 8.9% below the national average. As these numbers remind us, when Lawrence says it has an affordable housing problem, that is relative. Housing — the BEA uses rents as its overall proxy for housing prices — is still cheap here compared with national averages, but is not cheap compared with several metro areas or to the state as a whole.
• Kansas City Mo.-Kan.: 92.8 overall; 83.1 rents
• Lawrence: 91.1 overall; 83.4 rents
• Manhattan: 90.5 overall; 85.3 rents
• Wichita: 87.9 overall; 70.1 rents
• Topeka: 87.8 overall; 69.7 rents
• Kansas: 89.2 overall; 72.7 rents
It is always worth asking how much Lawrence’s status as a college community affects numbers like these. I’m sure it does a lot, but the list below shows there definitely are college towns that have a better mix of income and cost-of-living factors. The list below shows the income numbers adjusted for cost of living.
• Fayetteville, Ark: $70,600, down 0.2%
• Boulder, Colo.: $65,888, up 2.2%
• Iowa City: $55,217, up 1.1%
• Lincoln, Neb.: $51,348, up 1.2%
• Fort Collins, Colo.: $50,337, up 1.0%
• Columbia, Mo.: $48,499, up 2.0%
• Ames: $44,985, up 1.5%
• Waco, Texas: $43,137, up 0.6%
The most recent release also included totals for each state. Kansas fared pretty well on the list, posting the highest one-year growth rate of any state in the region. Here’s a look, with the numbers showing the per capita income numbers after adjusted for cost-of-living.
• Nebraska: $55,667, up 1.6%
• Colorado: $54,848, up 1.7%
• Kansas $54,728, up 3.5%
• Iowa: $53,277, up 2.3%
• Missouri: $50,155, up 1.8%
• Oklahoma: $49,633, up 2.4%
• Arkansas: $48,196, up 1.6%
Town Talk column
Plan for large annexation west of SLT shrinks by more than 300 acres; less land set aside for housing
With half the year done, Lawrence again on pace to set record low for single family home construction

Kansas City development company seeking to build $100M worth of housing at KU’s West Campus district

Lawrence home sales down for the year, despite an uptick in number of homes for sale

K.C. company plans to start program for Lawrence residents to recycle food waste, create area compost facility