New report shows how much retail has shrunk in downtown Lawrence; citywide vacancy rates also calculated

photo by: Sylas May
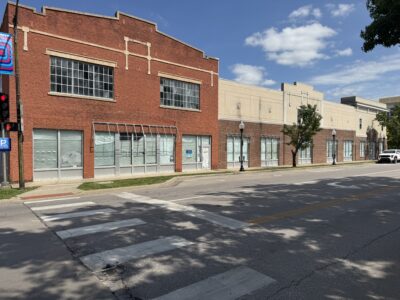
There are dozens of vacant storefronts in downtown Lawrence, including the one in the 800 block of Massachusetts Street that once housed the Buckle.
If you were to take a stroll in downtown Lawrence in 2006, a little more than two out of every five businesses you passed would have been a retail shop. Today, roughly two out of every 10 that you pass will be a retailer.
So, no, your eyes are not lying. Downtown is different these days. A new city report found downtown’s vacancy rate is higher than it has been in years, and even when the district is full, it has fewer retailers than in years past.
The quick takeaway is that downtown’s commercial vacancy rate is 13.5%, which is its highest rate since the city started producing this report in 2006. This rate — which measures square footage not storefronts — is up from 12.2% when the city last conducted the report in 2015.
Perhaps the more striking number though is that in 2006, downtown had 126 retail businesses. In September 2018, when data for this report was gathered, it had 72. Back in 2006, 43% of all businesses in downtown were retail. Now, only 21% are.
If you want to know why downtown feels different, read those numbers again.
And, if you think you have seen more “for lease” signs in downtown, you absolutely are right. In 2006, there were 28 vacant spaces. In 2018, there were 46. While the vacancy rate as measured by total square footage only increased by 3%, the number of vacant spaces increased by 64%. That is a lot more “for lease” signs for shoppers to notice, which creates all types of perceptions.
You might think that the biggest user replacing traditional retail in downtown has been bars and restaurants. On that front, you are only partially right. The biggest growth has come in nonretail uses, which can be banks or any of the relatively large number of office users that have come downtown. If you think about it, there has been good growth in downtown with architecture firms, web development offices, lawyers and other such users. (Apartments have grown too, but they’re not included in the report.) In 2006, only 23% of downtown was made up of those office type of uses. In 2018, office and other nonretail, nonrestaurant uses made up 42% of downtown. It has been the largest growth category by far.
But you are correct that there are more bars and restaurants downtown too. In 2006 there were 68 food and drink businesses in downtown. In 2018, there were 80. But, importantly, bars and restaurants in 2006 made up 23% of all businesses in downtown. In 2018, bars and restaurants still made up 23% of downtown businesses. If you are confused how that is possible, it is because downtown has grown with new buildings. As a result, the number of businesses in downtown has grown. There were 291 in 2006 and there are 347 in 2018.
That’s an important number to keep in mind too. There are many downtowns across Kansas that would love to have overall business growth. They laugh about our downtown concerns.
But fretting over downtown Lawrence is a local tradition, and one that has served us reasonably well. So, here’s a look at some more information from the city’s 2018 Retail Market Report about downtown and the city as a whole:

photo by: Jackson Barton
Brown paper covers the window of a storefront at 726 Massachusetts St. on Saturday, July 17, 2019.

photo by: Jackson Barton
A vacant downtown storefront is pictured Saturday, July 13, 2019 at 805 Massachusetts St. The space has been vacant since early 2017.
• Above-average vacancy: Downtown, long considered to be the most important commercial area in the city by many, continues to have a vacancy rate that is higher than the city as a whole. The overall commercial vacancy rate for Lawrence was 8.1%, compared to 13.5% in downtown. That citywide vacancy rate also is the highest since 2006, up from 7.4% in 2015, which was the previous high.
The report does note, though, that downtown’s vacancy rate would fall to 7.5% if it were not for two properties. High vacancy rates at the former Riverfront Mall and the Borders bookstore building count for almost 6 percent of the vacancy. But it also is worth noting that the report doesn’t count a couple of other big properties. The former Journal-World printing plant and the former Allen Press printing plant — both of which have been vacant or nearly vacant for several years — aren’t included in the city’s vacancy rate. That’s because both are considered to be more industrial than either retail or office space, Jeff Crick, a manager in the Lawrence-Douglas County Planning Department, told me.
How much vacancy is too much vacancy in a market is a topic that creates debate. But officials with the planning department, which compiled the report, told planning commissioners at a recent presentation that they found 8% to still be within the healthy range for a community. But they also said it was approaching the point of becoming higher than the community would prefer.

photo by: Jackson Barton
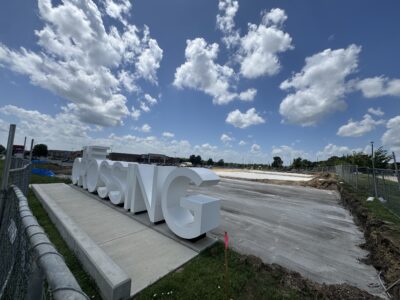
The sign for the Pine Ridge Plaza shopping mall is pictured Saturday July 13, 2019, in southern Lawrence.
• South Iowa strong: There used to be hand-wringing over whether south Iowa Street would overtake downtown as the prime commercial district in town. That debate is so over, at least numerically.
Of all the retail/restaurant square footage in town, 40.5% of it is in the south Iowa Street district. Downtown is a distant second at 11.2%. When you count office space and other commercial space that is not a store or a restaurant, downtown does better at holding its own against south Iowa Street. But it is still firmly in second place. South Iowa has 24% of all the commercial space in Lawrence, while downtown has 16.8%. In case you are wondering, West Sixth Street is a close third at 12.6%.
Furthermore, the report showed that south Iowa Street appears to be where retailers are looking to locate. While vacancy rates went up in downtown, they declined in the south Iowa Street district. South Iowa had a vacancy rate of 4.6% in September 2018, down from 6.3% in the 2015 report.
That 4.6% number is pretty low for a district that big. It is a prime reason why a development group has filed plans for a major shopping center development at the intersection of Kansas Highway 10 and South Iowa Street. Yes, that project is still formally being considered by the city. But no, there is not a significant update to be passed along. I’m told the development group — a firm out of North Carolina — is still evaluating some access issues with the site. How to get cars off of Iowa Street, which is also U.S. Highway 59, and into the center has been a big planning issue.
• Winners and losers: Elsewhere in the city, results were all over the board on whether vacancy rates increased or declined. West 23rd Street was a loser. If you remember, Hobby Lobby left its location on 23rd Street to move to south Iowa Street. Vacancy at the time of the report was 18.9%, up from 8.6% in 2013. The Kasold and Bob Billings area, though, has seen a big improvement after the main shopping center there went under new ownership. Vacancy was 5.4%, down from 20.4% in 2015.
Here’s a look at some other areas:
• Bob Billings and Wakarusa: 28.9%, up from 7.8%
• Clinton Parkway and Kasold Drive: 7.9%, up from 0%
• Ninth and Iowa streets: 4.9%, up from 1.6%
• Sixth and Wakarusa: 2.5%, down from 4.2%
• North Lawrence: 7.6%, down from 10.3%
• East 23rd Street: 15%, down from 16.8%
• 19th and Haskell: 22.2%, down from 25.5%
• Two in a row: This marks the second straight report from the city where downtown vacancy has been on the rise. Since the city started the report in 2006, downtown has never posted an increasing vacancy rate for three consecutive periods. Here’s a look at past downtown vacancy rates:
• 2006: 10.5%
• 2010: 9.0%
• 2011: 12.6%
• 2012: 9.3%
• 2015: 12.2%
• 2018: 13.5%
• Keeping pace: The city started doing this retail market report because there were fears the amount of retail space was growing at a rate much faster than the city’s population was growing. But since 2006, the report has found that hasn’t been the case. In 2006, the city had 45.9 square feet of retail space per person. In 2018, the per capita number actually had fallen to 44.6 square feet. It reached a high of 47.7 square feet per person in 2015.
When you add offices and other commercial space into the equation, the per capita numbers have risen a bit. Total commercial space per capita is now 97.6 square feet versus 80.8 square feet in 2006. It hit a high of 98 square feet in 2015.
Town Talk column
Plan for large annexation west of SLT shrinks by more than 300 acres; less land set aside for housing
With half the year done, Lawrence again on pace to set record low for single family home construction
Kansas City development company seeking to build $100M worth of housing at KU’s West Campus district

Lawrence home sales down for the year, despite an uptick in number of homes for sale

K.C. company plans to start program for Lawrence residents to recycle food waste, create area compost facility