New report shows Lawrence economy didn’t keep up with most metro areas in 2017

photo by: Courtesy: Bureau of Economic Analysis
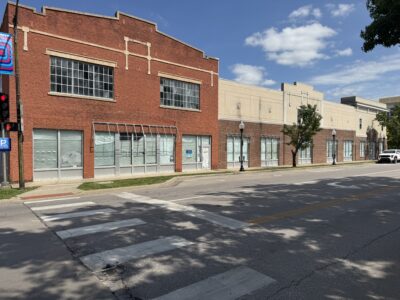
Even by Kansas’ standards, the Lawrence economy was a bit lackluster in 2017. By nearly everyone else’s measuring stick, Lawrence’s economic performance was near the bottom of the pack, according to a new set of federal statistics.
The new figures measure gross domestic product for all the metro areas across the country. GDP is basically the sum of all economic activity that takes place in a community. While there was a lot of talk nationally about the economy picking up steam in 2017, Lawrence’s economy failed to keep pace with many others, according to the numbers. The Lawrence economy grew by 1 percent in 2017, while metro areas across the country grew by 2.1 percent, on average. In other words, Lawrence grew at about half the rate of many other metro areas.
Lawrence’s growth rate ranked 242nd out of the 383 metro areas in the country.
When you look at just Kansas, Lawrence looks a bit better. It was a middle-of-the-pack community when compared to others in the Sunflower State in 2017. Here’s a look at each of the Kansas metro areas, with figures on the total size of their economies and their one-year growth rates:
• Manhattan: $3.3 billion economy, up 1.8 percent
• Kansas City, Mo.-Kan.: $114.4 billion economy, up 1.2 percent
• Lawrence: $3.9 billion economy, up 1.0 percent
• Topeka: $9.2 billion economy, up 0.2 percent
• Wichita: $29.6 billion economy, down 1.4 percent
But “Doing OK by Kansas Standards” isn’t exactly a great slogan these days. The state has underperformed several others in recent economic reports. When you create a larger list of regional cities, Lawrence’s ranking falls quite a bit. Here’s a list that includes quite a few other college communities in the region, as well as other towns that are just a few hours away from Lawrence by car.
1. Greeley, Colo.: $10.9 billion economy, up 9.4 percent
2. Fort Collins, Colo.: $15 billion economy, up 5.7 percent
3. Ames, Iowa: $4.4 billion economy, up 5.7 percent
4. Springfield, Mo.: $16.8 billion economy, up 3.8 percent
5. Boulder, Colo.: $22.6 billion economy, up 3.1 percent
6. Joplin, Mo.: $6.4 billion economy, up 2.8 percent
7. Oklahoma City: $67.7 billion economy, up 2.3 percent
8. St. Joseph, Mo.: $4.7 billion economy, up 1.9 percent
9. Manhattan: $3.3 billion economy, up 1.8 percent
10. Columbia, Mo.: $7.9 billion economy, up 1.5 percent
11. Jefferson City, Mo.: $6.3 billion economy, up 1.4 percent
12. Kansas City, Mo.-Kan.: $114.4 billion economy, up 1.2 percent
13. Lawrence: $3.9 billion economy, up 1.0 percent
14. Omaha: $56.2 billion economy, up 0.9 percent
15. Iowa City: $8.9 billion economy, up 0.5 percent
16. St. Louis: $139.5 billion economy, up 0.5 percent
17. Topeka: $9.2 billion economy, up 0.2 percent
18. Tulsa: $54.9 billion economy, down 1.1 percent
19. Wichita: $29.6 billion economy, down 1.4 percent
There is some good news for Lawrence, though. This is just one year. When you look at how much economies have grown over the last five years, Lawrence has the best growth rate in the state.
• Lawrence: up 8.9 percent since 2012
• Manhattan: up 7.9 percent
• Kansas City: up 7.5 percent
• Wichita: up 4.4 percent
• Topeka: down 1.7 percent
Yes, Topeka’s economy has shrunk — when adjusted for inflation — over the last five years. These numbers are a good reminder that Topeka has landed some economic development projects that Lawrence would have liked to have won, but Lawrence’s economy is outperforming in several other areas.
Lawrence’s five-year growth rate also stacks up bit better against the larger group of regional communities. Lawrence is basically middle of the pack over the last five years, compared to being in the bottom third for 2017. Here is a look:
1. Greeley: up 36.9 percent
2. Fort Collins: up 20.2 percent
3. Oklahoma City: up 14.5 percent
4. Boulder: up 13.1 percent
5. Omaha: up 12.8 percent
6. Springfield: up 11.4 percent
7. Columbia: up 10.3 percent
8. Iowa City: up 9.6 percent
9. Lawrence: up 8.9 percent
10. Manhattan: up 7.9 percent
11. Kansas City: up 7.5 percent
12. Ames: up 7.1 percent
13. Jefferson City: up 6.3 percent
14. Tulsa: up 5.9 percent
15. Joplin: up 4.5 percent
16. Wichita: up 4.4 percent
17. St. Louis: up 3.6 percent
18. Topeka: down 1.7 percent
19. St. Joseph: down 4.2 percent
Other facts and figures from the report include:
Lawrence had more industries that were showing growth than were declining in 2017. According to the figures, manufacturing, construction, professional and business services, entertainment/hotel/food services, trade/utilities and education/health care all posted positive GDP growth last year. Agriculture/oil and gas and information services were the only two industries to post declines.
The GDP report is always a good reminder of how small Lawrence’s economy is compared to most metros. Lawrence’s economy is the 335th largest out of the 383 metro areas across the country. Some of that is due to the fact Lawrence is sandwiched between two other metro areas — Kansas City and Topeka. As a result, Lawrence’s metro area comprises only one county — Douglas County — while most metro areas include multiple counties. Regardless, it still produces a relatively small economy. Here are the five economies that are just above and below us in terms of size: No. 330: Florence/Muscle Shoals, Ala.; No. 331: Williamsport, Penn.; No. 332: New Bern, N.C.; No. 333: Corvallis, Ore.; No. 334: Kokomo, Ind.; No. 336: Springfield, Ohio; No. 337: Kankakee, Ill.; No. 338: Goldsboro, N.C.; No. 339: Grand Island, Neb.; No. 340: Beckley, W.V.
Think about that for a moment: If Lawrence didn’t have a major university, we probably would be as famous as most of those places.
Town Talk column
Plan for large annexation west of SLT shrinks by more than 300 acres; less land set aside for housing
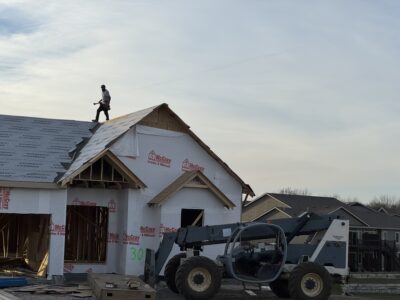
With half the year done, Lawrence again on pace to set record low for single family home construction
Kansas City development company seeking to build $100M worth of housing at KU’s West Campus district

Lawrence home sales down for the year, despite an uptick in number of homes for sale

K.C. company plans to start program for Lawrence residents to recycle food waste, create area compost facility