Some fire stations in Lawrence respond to fewer calls than others; a look at the data and whether it means anything for Station 6
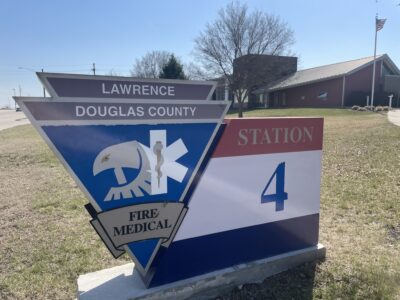
photo by: Sylas May/Journal-World
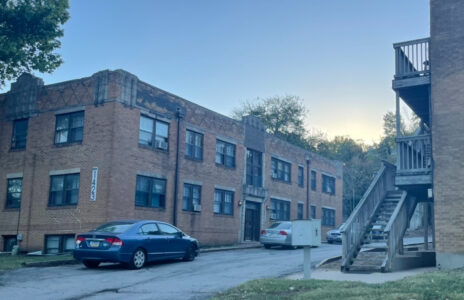
Fire Station 4 at 2121 Wakarusa Drive is pictured Wednesday, March 25, 2026.
As Lawrence-Douglas County Fire Medical prepares to add a new station in northwest Lawrence, Station 6, the department’s stats show that its two existing stations on the west side are responding to fewer calls than some stations farther east.
But that may not be an issue for Station 6, because LDCFM has said that what matters, and what Station 6 is trying to improve, is where the department can get to in four minutes or less.
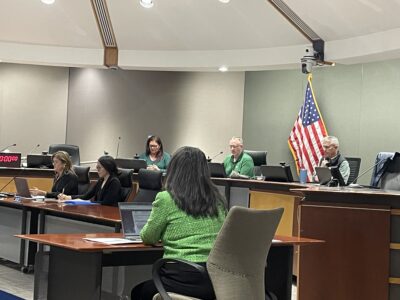
Station 6 would be at 555 Stoneridge Drive, near the intersection of Sixth Street and the South Lawrence Trafficway. It is expected to cost $12.9 million to build and more than $4 million a year to staff and operate, and city leaders have talked about a 3-mill property tax increase for 2027 to cover the future operating costs. At a City Commission meeting on March 10, Acting Chief Joe Hardy of LDCFM said the demand for service will be increasing as the city grows to the northwest.
“We just knew we were going to have to grow with the city growing and the demands and the needs,” Hardy told the commission then.
This week, LDCFM shared its annual report for the past year, 2025. The report contains a variety of statistics about fire and medical operations, including how many incidents the city’s five fire stations respond to.
Lawrence’s stations are spread out in different parts of the city. They are Station 1 in downtown, Station 2 in southeast Lawrence, Station 3 near Sixth and Kasold, Station 4 in southwest Lawrence and Station 5 near 19th and Iowa, adjacent to the University of Kansas campus.
But the data shows that the responses aren’t evenly divided among these five stations. Stations 1 and 5 have consistently responded to more calls in past years than Stations 2, 3 and 4.
The annual reports from the department don’t always include a response count broken down by station. In the past five years of reports, it’s included those stats for 2025, 2024 and 2022. Here are the numbers of responses from each station in each of those three years:
• Station 5: 6,836 in 2025, 6,895 in 2024, 5,854 in 2022.
• Station 1: 6,228 in 2025, 5,748 in 2024, 5,202 in 2022.
• Station 3: 5,238 in 2025, 4,771 in 2024, 4,471 in 2022.
• Station 2: 3,738 in 2025, 3,749 in 2024, 3,215 in 2022.
• Station 4: 3,422 in 2025, 3,674 in 2024, 3,082 in 2022.
Note that Station 5 does house more emergency vehicles than the other stations. According to past annual reports, it is the only fire station in the city that has two fire engines, or “apparatuses” in firefighting terminology. The other stations have one each. Every station also has one ambulance.
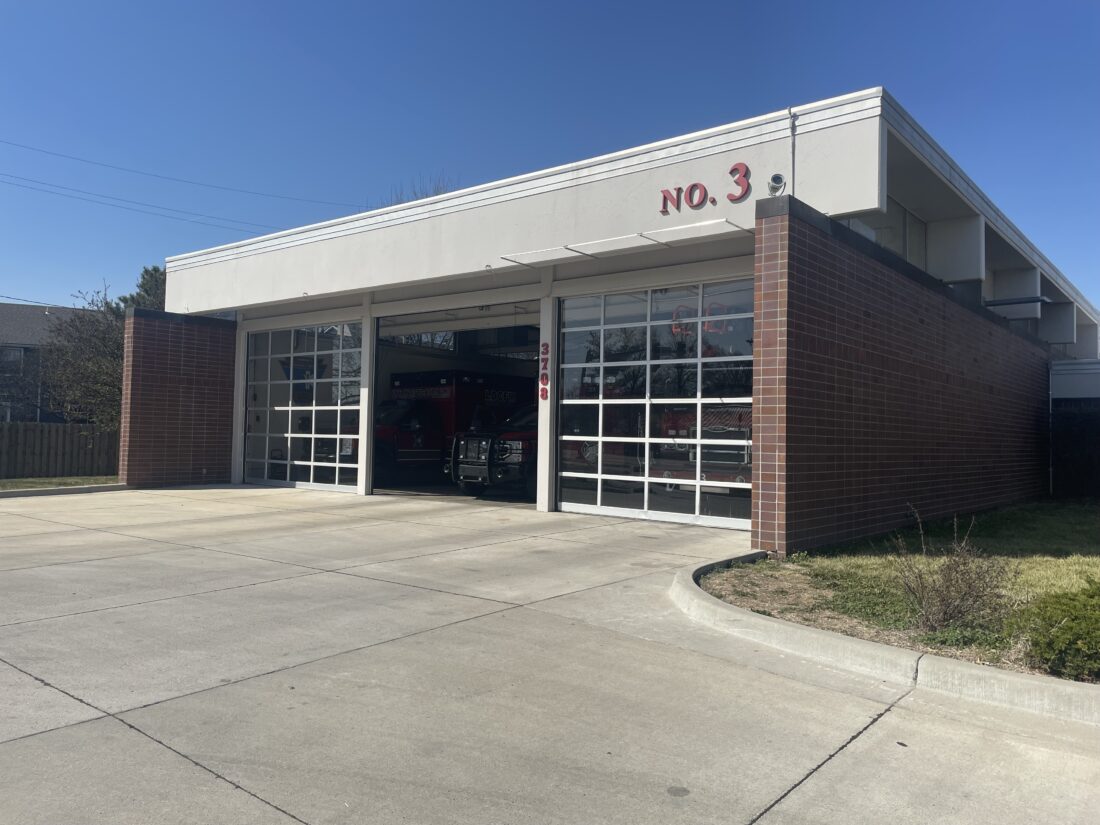
photo by: Sylas May/Journal-World
Fire Station 3 at 3708 W. Sixth St. is pictured Wednesday, March 25, 2026.
The Journal-World asked LDCFM for more context about the consistent differences in the numbers of responses for different stations. Specifically, the Journal-World asked whether it had anything to do with the stations’ own capacity to respond, or whether different parts of town tend to have fewer calls that require a response. The Journal-World had not received a response from the department as of 4 p.m. Wednesday.
Regardless of the differences in responses, past discussions about Station 6 haven’t focused on call volume as the main reason for the new station. Rather, they’ve focused on drive times.
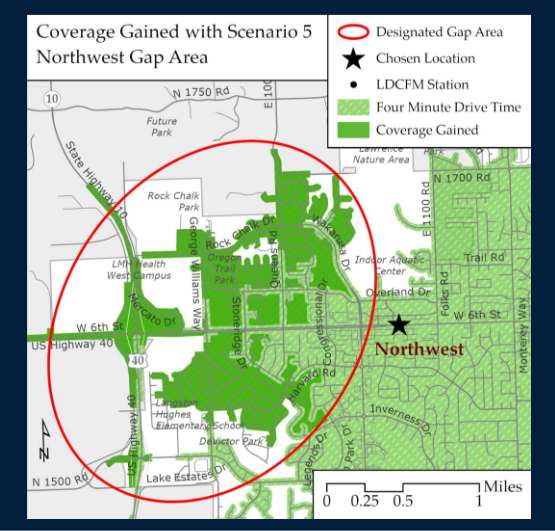
photo by: Contributed Image
This map from Lawrence-Douglas County Fire Medical shows a gap in response times in northwest Lawrence. The light-green areas are ones that can be reached by emergency responders in four minutes or less, and the dark green areas cannot be reached in that time.
LDCFM has created maps of where its vehicles can respond to in four minutes. That’s a standard set by the National Fire Protection Association, which says it represents the time when the first engine should arrive at the scene of a fire.
Northwest Lawrence is one of the gaps on that four-minute drive time map. Among the places the department says it can’t respond to in four minutes are Rock Chalk Park, the Sixth Street and South Lawrence Trafficway interchange and the SLT and Kansas Turnpike interchange. But with Station 6, all of those locations would be in the four-minute coverage area.
The city also expects to grow into areas that would be outside of the four-minute coverage area in the future. Developments have been proposed recently to the north on Queens Road and to the west of the SLT.
Now-retired fire chief Shaun Coffey, addressing the commission this month, stressed that the city’s response time was averaging around six minutes, and that even a couple of minutes could make a big difference in an emergency.
“Time is tissue. Time is life. Time is fire suppression,” Coffey said.
Here are some other stats from the LDCFM annual report and how they compare to past years:
• A rise in incidents. From 2021 to 2025, the number of incidents responded to each year by the department has risen by 22%. It was 14,560 in 2021, and it rose each year after that to reach 17,794 incidents in 2025.
In most of those years, the rise has been about 1,000 incidents per year. But between 2024 and 2025, the number only grew by 224 incidents, or 1.2%.
Looking back even further, the increase is even greater. Hardy told the commission last month that since 2006, when the department last added new stations, the number of incidents has risen by more than 70%. The department relocated Station 4 and added Station 5 in 2006, as the Journal-World reported.
“Just that demand on our department and our station and our call volumes, it’s just that pressure,” Hardy told the commission.
• Fires down, EMS up. LDCFM responded to 176 fire calls in 2025 and 12,666 EMS calls.
In recent years, the number of EMS calls each year has been rising – it was 11,956 in 2024, 10,722 in 2023, 9,792 in 2022 and 9,380 in 2021. That means they’ve risen about 35% in the past five years.
There isn’t a trend like that in fire calls, which seem to fluctuate from year to year. But this year’s total was the lowest in any of the past five years. No other year dipped below 200.
The fire calls don’t count false alarms; there were 1,513 of those in 2025.
• How busy was the department? In 2025, the department averaged 49 calls per day. The busiest month in 2025 for LDCFM was March, when it responded to 1,648 incidents, and the busiest single day was in March with 77 incidents.
City Government
Some fire stations in Lawrence respond to fewer calls than others; a look at the data and whether it means anything for Station 6

These designers want to capture Lawrence’s World Cup moment in wearable public art

About 5K Lawrence residents receive the wrong water and sewer bill from the city due to tech issue
Lawrence’s Historic Resources Commission recommends further review of proposed super-dense apartment complex in Oread neighborhood
City of Lawrence names longtime prosecutor as next Municipal Court judge