Survey shows Lawrence crime rate higher than average in several categories
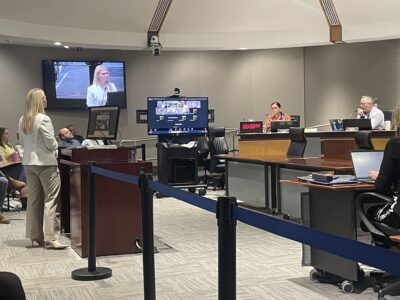
As the Lawrence City Commission prepares to discuss resources for the Lawrence Police Department in a study session at 4 p.m. Tuesday at City Hall, numbers from a recent survey including 27 other cities showed Lawrence’s crime rate was higher than the average in many categories.
Lawrence Police Chief Tarik Khatib, who was promoted to the job in February, has said the department needs more patrol officers to help with a community policing initiative aimed at reducing crime. Khatib has requested $1.2 million from the commission to add 10 patrol officers, a detective, three sergeants and some equipment. It would amount to a 1.4-mill increase to the city’s property tax rate, or $32 per year more annually for the owner of a $200,000 home.
The study session also could involve discussion about long-term plans for the department, including a desire to have the department housed in one facility.
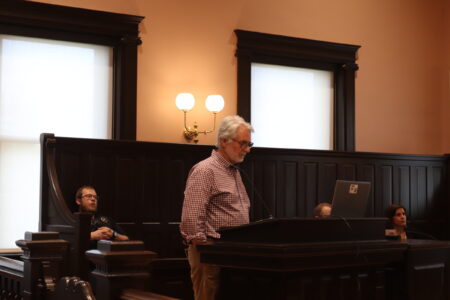
“I hope we can come up with a five- to seven-year plan to address both (staffing and facilities). It’s tight right now,” Commissioner Hugh Carter said. “But the first thing we need to get a handle on is to find out what we’re really up against and to come up with a timeline.”
Here are some statistics from the 2010 Benchmark City Survey, which includes 28 police departments in cities from across the nation:
Crimes per 1,000 residents
- Lowest: Naperville, Ill., 16.0
- Highest: Springfield, Mo., 103.7
- Average among cities: 33.6
- Lawrence: 47.4 (27th highest of 28)
Violent crimes per 1,000 residents
- Lowest: Edmond, Okla., Naperville, Ill., 0.9
- Highest: Springfield, Mo., 8.3
- Average: 2.7
- Lawrence: 3.6 (24th highest)
Property crimes per 1,000 residents
- Lowest: Naperville, Ill., 15.1
- Highest: Springfield, Mo., 95.4
- Average: 31.0
- Lawrence: 43.7 (27th highest)
Domestic violence offenses per 1,000 residents
- Lowest: Edmond, Okla., 0.6
- Highest: San Angelo, Texas, 16.7
- Average: 5.7
- Lawrence: 8.6 (22nd highest)
Fraud and forgery offenses per 1,000 residents
- Lowest: Coral Springs, Fla., 0.3
- Highest: Lawrence, 12.5
- Average: 4.3
Calls for service per 1,000 residents
- Lowest: Naperville, Ill., 274.4
- Highest: Broken Arrow, Okla., 829.5
- Average: 462.3
- Lawrence: 599.9 (23rd highest)
Calls for service per officer
- Lowest: Bellevue, Wash., 196.7
- Highest: Broken Arrow, Okla., 661.3
- Average: 323.9
- Lawrence: 370.2 (21st highest)
Officers per 1,000 residents
- Lowest: Fremont, Calif., 0.85
- Highest: Springfield, Mo., 2.06
- Average: 1.43
- Lawrence: 1.62 (23rd highest)
Other area cities involved in the 2010 survey include Overland Park; Olathe; Lincoln, Neb.; Fort Collins, Colo.; Norman, Okla.; and Boulder, Colo.
City Government
Developer seeks incentive from City of Lawrence to build 131 units of housing near Wakarusa and Queens

Lawrence city leaders will consider whether to keep Community Building open, make 2 other rec centers free to access
A STAR Bond application raises questions for city leaders about Costco and housing west of the SLT

Soccer gear honoring Lawrence history’s all-star team is now on sale as part of city’s public art exhibition
To honor public servants, Lawrence’s July 4 celebration will have a whole gallery of their photos on display; submissions open now