Census data tells us about ourselves

Local Census leaders will put stickers on pizza boxes to remind university students to fill out their Census forms.
If nothing else, do it for the love of the data.
Sure, you’ve heard how federal law requires you to send in your Census form. You’ve heard how accurate Census numbers can amount to billions of dollars in federal funding for a community.
But researchers say don’t forget the value of the data itself. If you want leaders and planners to understand your community, good Census data is often the place to start.
“There has been a very visible discussion about schools in this community,” said Ken Grotewiel, co-chairman of the Douglas County Complete Count Committee. “Whenever you are talking about allocating scarce resources to where the needs are, population comes into play.”
But the Census is about much more than just population. Although the Census forms — which all residents in Douglas County now should have received — mainly ask questions to determine population, those numbers are then used to gather much more detailed information.
The Census Bureau each month does surveys in communities across the country to figure out everything from how long a person commutes to work to how many people are living below the poverty line. Since the Census Bureau uses surveys to extrapolate data, having an accurate population total to begin with is key.
“In a roundabout way, the decennial Census is really the core data that control all the other data we’re going to receive for the next 10 years,” said Xan Wedel, an information specialist who works frequently with Census data at Kansas University’s Institute for Policy and Social Research.
“Basically, the more people who participate now, the better quality of the data we’re going to get,” she said. “And hopefully, better quality data will mean better decisions by our leaders.”
What the Census tells us
So, just what type of light can Census data shed on a community? Here’s a look at some tidbits gleaned from the most recent American Community Census report for Lawrence:
• 5,932 people in Lawrence carpool to work. That’s 12 percent of the total. Of the total, 73 percent drive alone. Another 6.8 percent, or about 3,300 people, walk to work.
• 14,031 people in Lawrence have some sort of government job. That’s 27 percent of the total, which is well above the statewide average of 16 percent.
• The average wage for a male full-time employee in Lawrence is $41,674. That’s below the statewide average of $43,331. The average wage for a female full-time employee is $33,752. That’s above the statewide average of $31,995.
• The percentage of families living below the poverty line is 10.7 percent. The statewide average is 8 percent.
• The largest number of existing houses in Lawrence were built between 1970 and 1979. That age range accounts for 21 percent. Homes built in 1990s account for 19 percent.
• 44 percent of Lawrence residents moved into their home in 2005 or later. That compares with a statewide average of 31 percent.
• 13,535 homes in Lawrence do not have access to a vehicle. That’s 5.7 percent, which is only slightly higher than the statewide average of 5.1 percent.
• 74 percent — or about 13,000 — homes in Lawrence have a mortgage. Statewide the average is 65 percent.
• 60 percent of Lawrence homeowners had average monthly housing costs — the cost includes a mortgage, utilities, insurance and taxes — of $1,499 or less. Statewide, 68 percent of homeowners had their costs fall within that range.
• 51 percent of renters had a monthly rent of $749 or less. Statewide, 63 percent had a rent of $749 or less.
• 49 percent of Lawrence renters paid 35 percent or more of their household income in rent. Statewide, 35 percent of renters paid 35 percent or more of their income in rent.
• 8,836 households in Lawrence had somebody under the age of 18. That’s 25 percent of the total. Statewide, the average was 34 percent.
• 56 percent of Lawrence males 18 and older have never been married. It is 49 percent for Lawrence females. Statewide, the numbers are 30 percent and 23 percent, respectively.
• 91 percent of all Lawrence residents were born in the United States; 51 percent were born in Kansas. Statewide, the numbers are 93 percent and 59 percent, respectively.
• 86 percent of Lawrence residents are white, 6 percent black. Statewide, it is 88 percent white and 6 percent black.
• 4 percent of Lawrence’s population is Hispanic. 8 percent of the state’s population is Hispanic.
All the numbers are three-year averages taken from the Census Bureau’s 2006 to 2008 community surveys. Lawrence, because of its size, has been part of the survey for multiple years. Smaller communities, though, will get their first data from the survey in December.
From that point forward, the Census Bureau will produce data for every city and geographical location in the country on an annual basis, Wedel said.
“I’m excited,” Wedel said. “There will be a flood of data.”
City Government
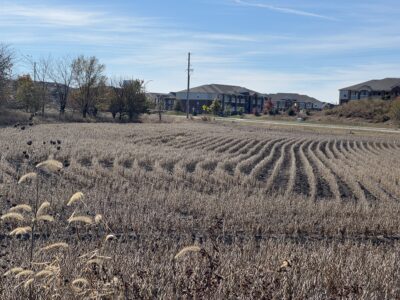
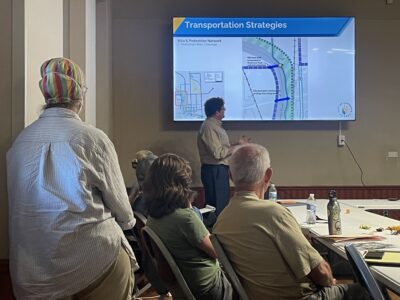
Developer seeks incentive from City of Lawrence to build 131 units of housing near Wakarusa and Queens

Lawrence city leaders will consider whether to keep Community Building open, make 2 other rec centers free to access
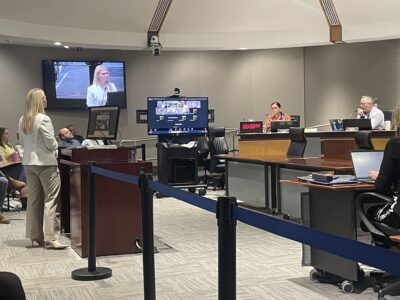
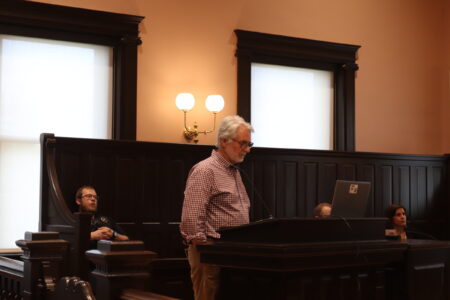
A STAR Bond application raises questions for city leaders about Costco and housing west of the SLT

Soccer gear honoring Lawrence history’s all-star team is now on sale as part of city’s public art exhibition
To honor public servants, Lawrence’s July 4 celebration will have a whole gallery of their photos on display; submissions open now