Much has changed since unemployment last hit 10 percent
Washington ? The last time unemployment climbed past 10 percent, “The A-Team” was one of the top 10 TV shows and Michael Jackson was about to release “Thriller.”
Much has changed since the jobless rate hit 10.1 percent in September 1982, including the composition of the nation’s labor force. American workers are now older, more educated and more Latino. The elderly are more likely to be working. Fewer teenagers are in the work force.
After the last time the unemployment rate entered double digits, it stayed there for several months, through June 1983. By the time the rate got above the 10 percent mark again — hitting 10.2 percent last month — the proportion of workers employed in health care and education had nearly doubled since 1982, and manufacturing employment had shrunk by more than half.
Lawyers make up a bigger slice of the work force now. So do people who work in restaurants, hotels and other parts of the leisure and hospitality industry.
Here, by the numbers, are some other ways the work force has changed since September 1982.
More people, more workers
110.7 million: Size of the work force in September 1982
154 million: Size of the work force in October 2009
The “he-cession”
10.7 percent: Adult male unemployment rate in October 2009
8.1 percent: Adult female unemployment rate in October 2009
27.6 percent: Teenage unemployment rate in October 2009
9.5 percent: Adult male unemployment rate in September 1982
8.4 percent: Adult female unemployment rate in September 1982
23.6 percent: Teenage unemployment rate in September 1982.
Analysis: The greater disparity between men and women in this recession reflects the heavy impact of layoffs in male-dominated fields, such as construction and manufacturing. Industries with higher female employment, namely education and health care, have actually added jobs during the recession.
Education matters …
15.5 percent: Unemployment rate in October 2009 for those without a high school diploma
11.2 percent: Rate for high school graduates
4.7 percent: Rate for college graduates
3 percent: Unemployment rate in March 1982 for college graduates (at the time, figure was reported once a year)
… But is no guarantee
6.8 percent: Proportion of unemployed with college degree in September 1982
14.7 percent: Proportion in October 2009
Analysis: College graduates still have much lower jobless rates than those with less education, but they are more likely to be unemployed than in 1982. Job cuts in the financial industry and in high-skilled manufacturing, such as the aerospace industry, have caught up with them, according to Gary Burtless, an economist at the Brookings Institution. And companies in all sectors are more willing to cut middle managers than in previous recessions, he added, which also affects college graduates.
More Latinos in work force
22.5 million: Number of Hispanics in work force in October 2009
6.7 million: Number in work force in September 1982
13.1 percent: Hispanic unemployment rate in October 2009
14.4 percent: Hispanic jobless rate in September 1982
States hardest hit
• In September 1982
Michigan: 15.8 percent
West Virginia: 15.6 percent
Alabama: 13.8 percent
Ohio: 13.1 percent
Illinois: 12.2 percent
• In September 2009
Michigan: 15.3 percent
Nevada: 13.3 percent
Rhode Island: 13 percent
California: 12.2 percent
South Carolina: 11.6 percent
Analysis: Manufacturers in the rust belt were hit particularly hard in the early 1980s, putting Midwestern states such as Michigan, Ohio and Illinois in the top 5. While Michigan again has the nation’s highest unemployment today, states like Nevada and California are suffering from the housing bubble.
National
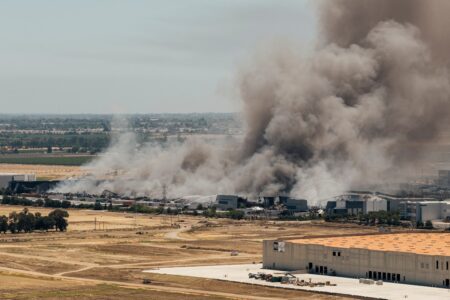
Unhealthy air quality in California city as huge warehouse fire burns for 3rd day
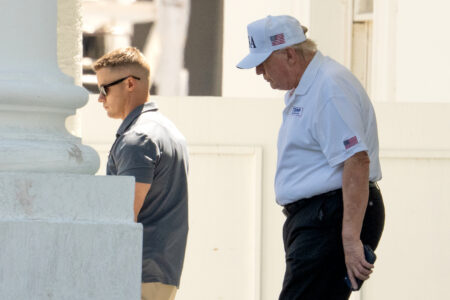
Judge orders Trump administration to restore National Park changes at sites that ‘disparaged’ US
Teens’ reading and math scores have stagnated, US test results show
WASHINGTON (AP) — Younger students have regained ground academically after the pandemic's disruptions while older ...
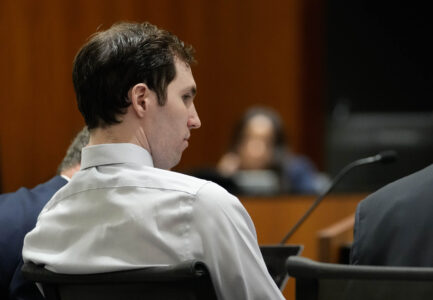
Lawyers for man accused of killing Charlie Kirk try to block death penalty
Trump’s name poised to come off Kennedy Center