Percentage of Americans who moved declines sharply
Washington ? The number of Americans who moved declined sharply last year, reaching the lowest percentage in 60 years as people grappled with fewer jobs and tighter credit.
Roughly 11.9 percent of the nation’s population — or 35.2 million people — moved to a new home, down from 13.2 percent the previous year, according to census data released Wednesday. It was the sharpest percentage drop in U.S. mobility since the 2000 bursting of the tech bubble, which bankrupted many Internet startups and caused the dwindling of stock portfolios.
The levels of people moving have been declining for decades, more recently because of an aging boomer population that is less mobile, since hitting a peak of 21 percent in 1951. But the rate had generally leveled off at around 13 to 14 percent before last year’s drop.
Longer-distance moves between states have dropped 36 percent since 2005 to about 4.7 million, reflecting the housing downturn.
William Frey, a demographer at Brookings Institution, said declining U.S. migration to residential magnets in th suburbs and exurbs, and particularly in the Sunbelt, were driving the low moving rates overall.
“It’s a combination of the inability to buy or sell homes, locally, as well as a drying up of jobs particularly in hot housing markets,” he said. “The lure of the suburbs for immigrants, in particular, has been curtailed as homeownership there has proved to be elusive.”
The demographic numbers highlight the task ahead for the bureau, which is gearing up for next year’s decennial head count that will be used to apportion House seats.
Minorities and poor people were more likely to move than whites, according to the data. Immigrants increasingly headed to dense urban areas rather than the wide-open suburbs compared to years past, underscoring government concerns that these groups will prove difficult to count. The bureau has said that tens of millions of residents are at risk of being missed in cities such as Los Angeles and New York.
National
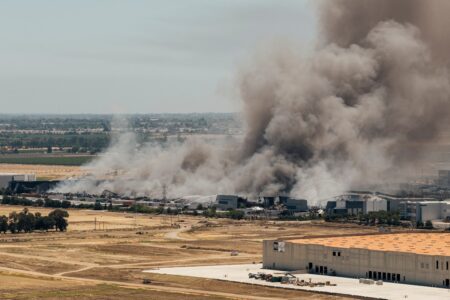
Unhealthy air quality in California city as huge warehouse fire burns for 3rd day

Judge orders Trump administration to restore National Park changes at sites that ‘disparaged’ US
Teens’ reading and math scores have stagnated, US test results show
WASHINGTON (AP) — Younger students have regained ground academically after the pandemic's disruptions while older ...
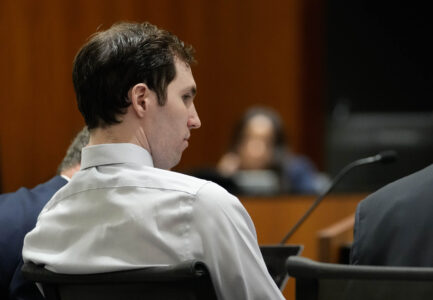
Lawyers for man accused of killing Charlie Kirk try to block death penalty

Trump’s name poised to come off Kennedy Center