
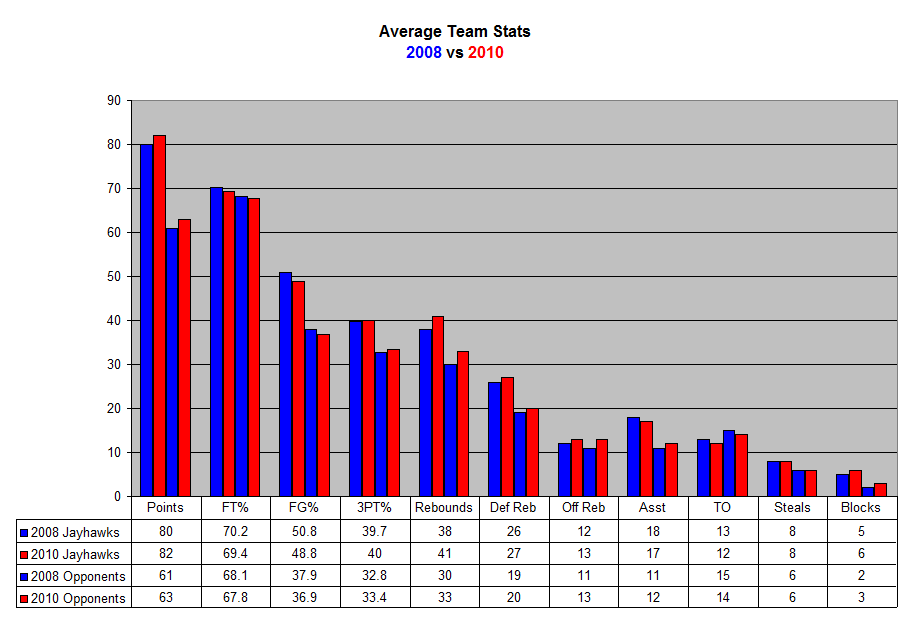
By the numbers: 2008 vs. 2010 Jayhawks
[Taylor Witt is a Kansas University senior from Prairie Village majoring in Journalism. He is serving an internship with The Lawrence Journal-World sports staff.]
For many Kansas fans, the 2008 national championship year seemed almost like a dream. The team dominated games while appearing to hardly try, enjoyed running teams off the court, and had a real killer instinct. But some people may not realize how close these current 2010 Jayhawks are to performing at the level that made them champions in 2008.
Here is an in-depth look at the similarities and differences between Mario’s Miraculous 2008 Jayhawks and Sherron’s Sensational 2010 Jayhawks.
On the surface, it’s easy to see how this year’s size matches up with the championship team.
• Kaun and Aldrich at 6-foot-11
• Rush and Henry at 6-foot-6
• Jackson and Marcus at 6-foot-8
• Arthur and Markieff at 6-foot-9
• Robinson and Chalmers at 6-foot-1 vs. Reed and Morningstar at 6-foot-3
And the experience factor is about the same, with a slight edge to the ’08 squad. And if you look at their average stats and their opponents’ average stats, there’s nothing that really jumps out as a big difference between the two squads.
http://worldonline.media.clients.ellingtoncms.com/img/blogs/entry_img/2010/Feb/25/Average_Stats.png
See a larger version of this graph.
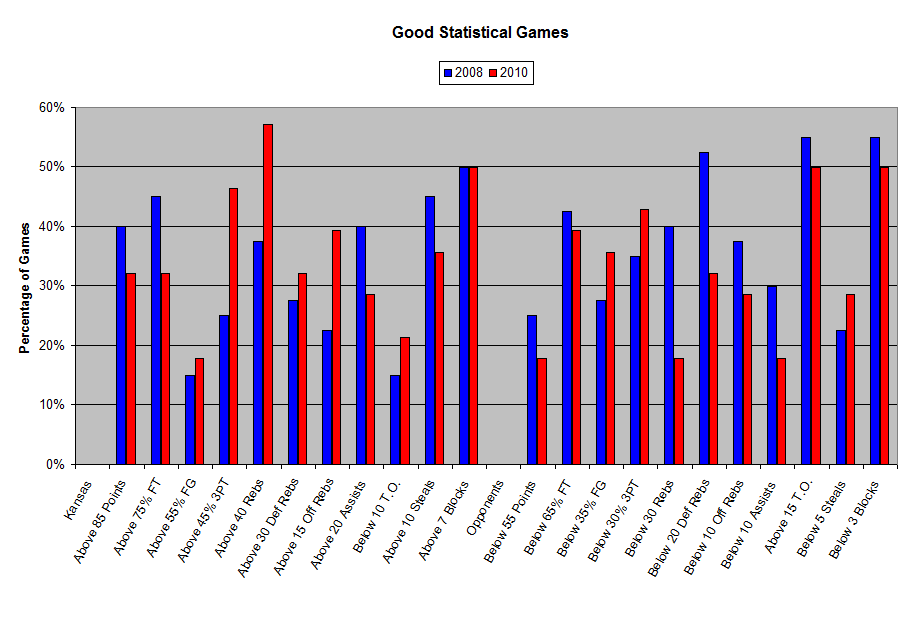
So I decided that an interesting way to approach analyzing these two teams would be to see how consistent the teams were. By that I just mean how often they performed “good” statistically, versus how often they performed “bad.” I took their average team stats, average opponent stats, and established some values above and below those averages which I called “Good” and “Bad.”
For example, both teams average scoring around 80 points, and their opponents averaged around 60. So, I said that a good offensive game would be above 85 points, and a bad one would be below 75. Likewise, a good defensive game would be allowing 55 points or below, and a bad game would be 65 points and above. Now, I know that the pace of the game and the opponent have a lot to do with the total points, so these numbers aren’t exactly scientific, but they do attempt to show consistency more than average season stats would.
Note: Because ’08 played 40 games and ’10 has only finished 28 games, the data is expressed in percentages.
http://worldonline.media.clients.ellingtoncms.com/img/blogs/entry_img/2010/Feb/25/good_games.png
See a larger version of the good statistical games graph.
http://worldonline.media.clients.ellingtoncms.com/img/blogs/entry_img/2010/Feb/25/bad_games.png
See a larger version of the bad statistical games graph.
Where this year’s team shines is the Good offensive stats. When they’re good, they’re better (and usually significantly better) than the 2008 team at:
• Shooting above 45% 3PT (25% vs 46.4%)
• Grabbing above 40 total rebounds (37.5% vs 57.1%)
• Grabbing above 15 offensive rebounds (22.5% vs 39.3%)
And holding its opponents to:
• Below 35% FG (27.50% vs 35.71%)
• Below 30% 3PT (35.00% vs 42.86%)
• And less than 5 steals (22.50% vs 28.57%)
This is where Cole Aldrich really makes his presence known. While the Morris twins pull down a number of rebounds, Aldrich makes the 2010 team a rebounding force, shown by its ability to grab 40 boards in about 20% more of its games than the 2008 squad.
The offense is also now much more three-ball friendly, with just about everyone not named Aldrich knocking down shots from beyond the arc. When 2008 did damage from the perimeter, it was Rush, Chalmers, and occasionally Collins and Robinson. Jackson, Arthur, and Kaun were all non-threats from outside, and nobody else who could shoot played any significant minutes. This year, contributions from Collins, Henry, Reed, Morningstar, and even the Morris twins mean that this team is much more dangerous from three. Not including any player who doesn’t play “regularly” for each team, the 2008 squad made 5.8 threes per game, and the 2010 team is on pace for 7.0 threes per game.
Defensive numbers also seem to suggest that the 2008 team was a better overall defensive unit, and with shut-down guys like Chalmers, Rush, and Robinson on the perimeter, that should come as no surprise. But what really shocked me was that this year’s squad has had more success in defensive field goal percentage stats. As evident by its national-best 36.9 opponent field goal percentage, this year’s team really forces its opponents into some bad shots. (As a reference, the championship squad was nearly as impressive, holding opponents to 37.9%, good for 3rd nationally in 2008.)
So, you might be asking, what does all of this mean?
When the 2008 championship team was on the mark, they were better than this year’s team at free throw shooting, assisting, and holding its opponents to very few rebounds. But when the 2010 squad is good, it’s much better at shooting lights out from deep, rebounding, and making sure opponents shoot a poor percentage.
When this year’s team is bad, it’s shooting poorly and letting its opponent shoot from deep and rebound. However, when it’s bad, it’s not as bad as 2008 was in grabbing rebounds and shooting free throws.
To me, this suggests that this year’s team (if it wasn’t obvious by its 27-1 record) is just as capable of cutting down the nets in April as the team two years ago was, based on its ability to hit the long-range shot and consistently shut down opposing shooters. If this trend continues, nobody in the nation (perhaps outside of Lexington, Ky.) will be surprised if KU is crowned national champion for the second time in three years.