In-state students dominate KU
If you haven’t noticed already, you’ll soon find that most Kansas University students are white. Well-tanned, perhaps, but still Caucasian.
In fact, during last year’s head count, 81 percent of the 25,782 students on the Lawrence campus fit the category “white, non-Hispanic.” The rest were:
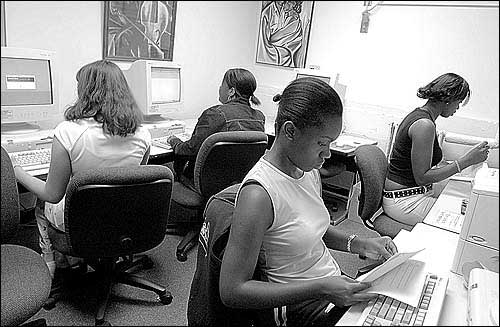
Korbalagae Kuawogia, Topeka sophomore, foreground, works on a final report for her geology class. Kuawogia was using a computer at the Multicultural Resource Center.
Black, 2.6 percent
Hispanic, 2.4 percent
Asian, 3.1 percent
American Indian, 0.9 percent
Unknown, 4 percent
Foreign students, 6.1 percent.
That’s not too surprising, considering that most KU students come from Kansas and that, according to the 2000 Census, 86 percent of the state is white.
But while the numbers of Hispanic, Asian and American Indian undergraduates have more than doubled in the past 15 years, the number of black students has declined, going from 621 in 1987 to 518 in 2002.
For the same period, the number of black graduate/law students has increased, going from 95 in 1987 to 148 in 2002. Black graduate/law student enrollment peaked in 1997 with 207 students.
“We’re not sure why that is,” said Lisa Pinamonti, head of recruitment at the university’s Office of Admissions and Scholarships.
Journal-World attempts to reach KU’s Black Student Union for comment were unsuccessful.
KU, Pinamonti said, is doing all it can to reverse the trend.
“The whole university has really been working on this,” she said. “There have been a couple committees that focused on finding ways to make a stronger and more personal focus on recruiting students of color. And in my office, we now have two assistant directors who are doing just that.”
Pinamonti said the university had posted an increase in minority student visits in 2002. Whether this leads to a corresponding increase in enrollment remains to be seen.
“We won’t know until the 20th day of the 2002-2003 school year,” she said, referring to the day when student numbers are officially tallied.
“And it may not happen this year,” she said. “It may take another two or three years to see results. We hope that doesn’t happen, but it could.”
Pinamonti said KU was making more overtures in person, through the mail and by telephone to minority students than ever before.
This quest for more diversity serves the university well, said Santos Nunez, program director at KU’s Multicultural Resource Center.
“Diversity is always good for the university. It promotes diverse ideas, diverse ways of thinking,” Nunez said. “It helps all of us realize the world is made up of many different cultures. There are many different races, religions and ethnicities, and the more we understand that, the better we can all do our jobs.”
Last year, 1,720 foreign students were enrolled at KU. Their top five homelands were China, India, Japan, South Korea and Saudi Arabia.
Still, more than two-thirds of students at KU are from Kansas.
Johnson County accounted for more than 7,000 students last year, by far the most of any Kansas county; Douglas County was second with 3,182.
Other counties in the top 10 were Sedgwick (1,825), Shawnee (1,236), Wyandotte (659), Leavenworth (533), Reno (242), Saline (261), Riley (243) and Butler (212).
Behind Kansas, Missouri generated the most students with 2,015. Other states in the top 10 were Illinois (837), Nebraska (503), Texas (481), Minnesota (400), Colorado (329), Oklahoma (387), Iowa (284), California (196) and Ohio (83).
Almost 80 percent of the students at KU go to school full time.
The freshman class is the largest, accounting for 23.4 percent of the students on the Lawrence campus. The others:
Sophomores, 15.5 percent
Juniors, 15.2 percent
Seniors, 19.5 percent
Graduate students, 21.2 percent
Law students, 1.9 percent.
Of the 20,746 undergraduates at KU last year, 54.9 percent were liberal arts and science majors. The School of Engineering accounted for the second largest enrollment with 6.2 percent; followed by fine arts, 5.2 percent; journalism, 3.1 percent; and social welfare and pharmacy, both at 1.9 percent.
The average undergraduate and graduate students are 21 and 32 years old, respectively.
KU

The annual summer solstice tour of the KU Native Medicinal Plant Garden will be held later this month

KU Homecoming parade to return to campus after seven-year absence
‘Backyard’ allows even more fans to cheer on Jayhawks

Dole Institute of Politics announces summer lineup celebrating America’s 250th anniversary
KU Hospital Authority says CVS stole nearly $62M in drug savings
The University of Kansas Hospital Authority is suing CVS and its subsidiaries, alleging the mega pharmacy company ...