
Which version of Frank Mason was better? 2014-15 or 2015-16?
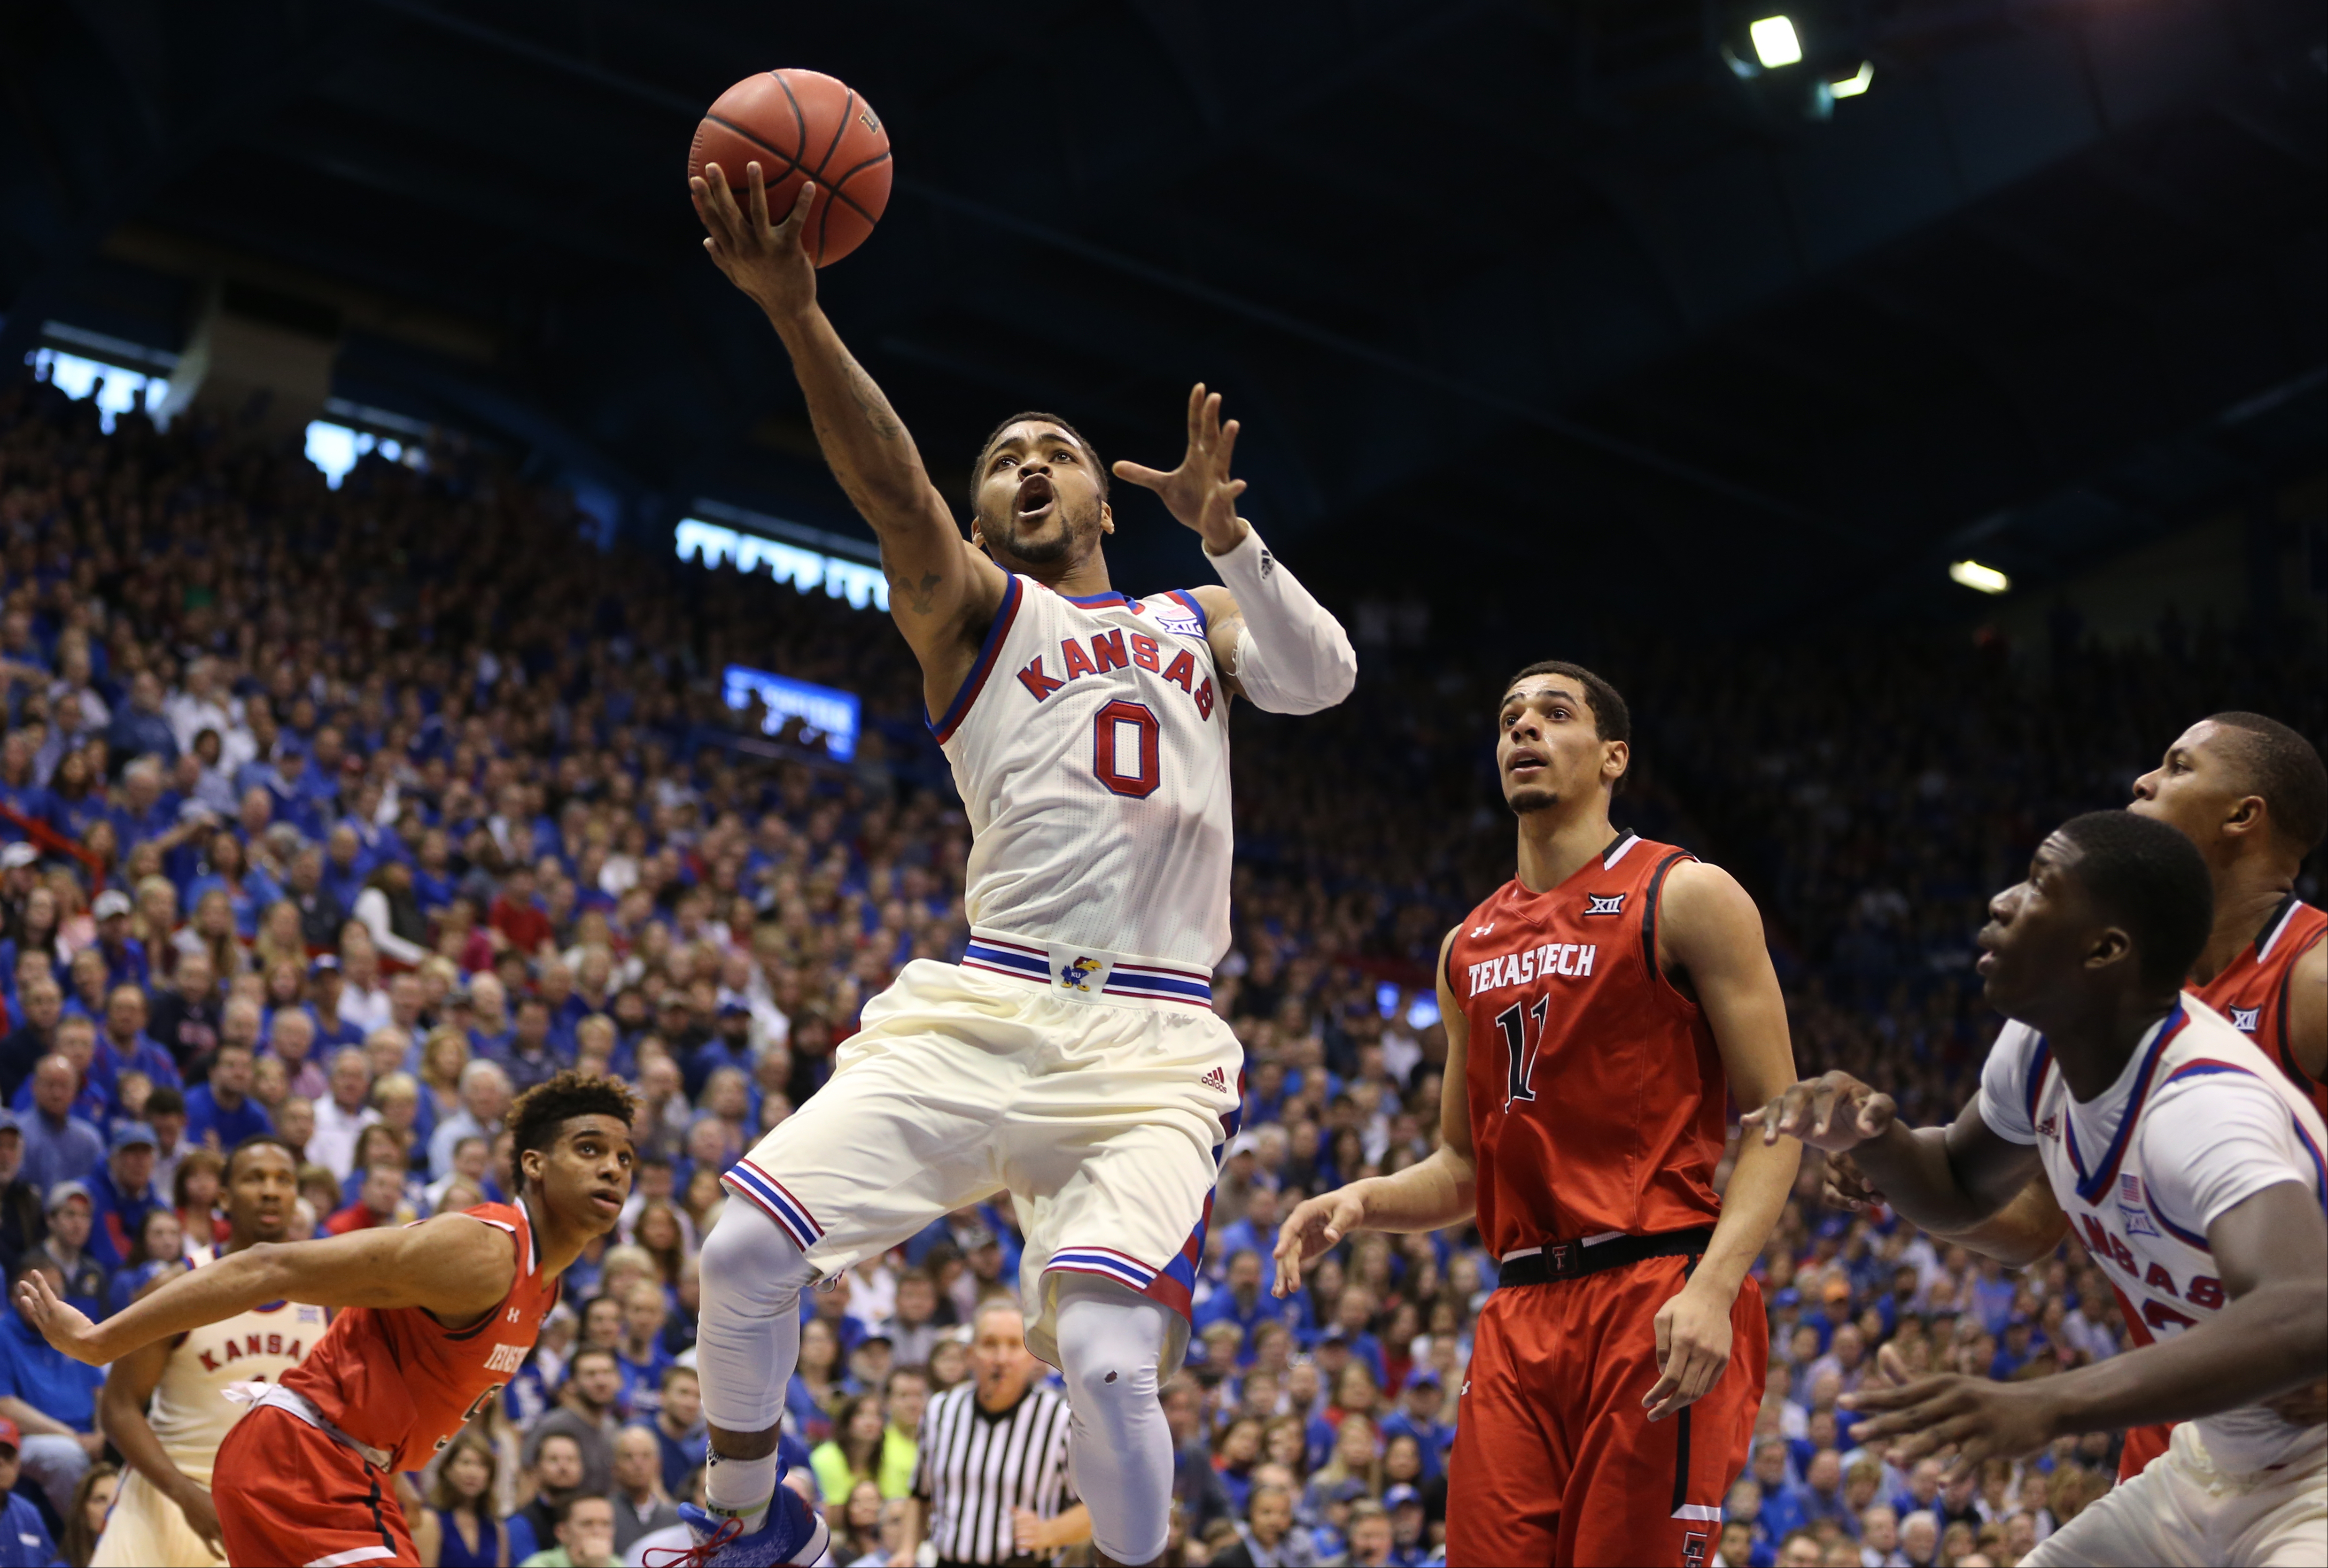
photo by: Nick Krug
Kansas guard Frank Mason III (0) floats in for a bucket past Texas Tech forward Zach Smith (11) during the second half, Saturday, Feb. 27, 2016 at Allen Fieldhouse.
The speculation from most fans and observers regarding Kansas guard Frank Mason throughout the 2015-16 KU men’s basketball season was that some kind of nagging injury might have been bothering him during various portions of the Jayhawks’ run to a 33-5 record and trip to the Elite Eight.
There certainly were times when Mason, a junior from Petersburg, Virginia, looked a little off of his game and did not play at the same level that he had during his stellar sophomore season.
Mason, like the consistently solid player he has proven to be, always found a way to contribute and, more importantly, always bounced back from those rough stretches, but it seemed to me and most of the people I talked to about Mason throughout the season that he was not playing at quite the same level as a junior as he did as a sophomore.
With the season now in the past and my curiosity racing, I checked out Mason’s stats from both seasons to see how they compared.
The result? It turns out Mason is way more consistent than I even realized.
photo by: Nick Krug
Kansas guard Frank Mason III (0) floats in for a bucket past Texas Tech forward Zach Smith (11) during the second half, Saturday, Feb. 27, 2016 at Allen Fieldhouse.
In the 25 statistical categories kept every season for each player, Mason stayed the same or improved in 20 of them.
The entire lot will be outlined a little later, but, for now, let’s focus on the five categories in which he took a step backwards.
• FG percentage — Mason shot .434 as a junior, seven tenths of a percentage point lower than his .441 average as a sophomore. The interesting thing about this stat, however, is that Mason both took and made more shots during his junior season, with the higher number of attempts creating the slightly lower shooting percentage. It’s also worth noting here that Mason, who played in and started every game during the past two seasons, received the benefit of two more games as a junior because the Jayhawks advanced two rounds farther in the NCAA Tournament. So keep that in mind when reading these stats.
• Three-pointers attempted — Depending on how you look at it, this, too, could have gone down as an “improvement” because Mason took 113 threes as a junior and just 98 as a sophomore. The reason I tossed it into the “got worse” category, though, was because the higher volume of three-point attempts led to Mason shooting a worse percentage.
• Three-point percentage — Mason shot .429 from behind the three-point line as a sophomore and dipped to a .381 three-point shooter his junior season. As mentioned above, the 15 more attempts (again, remember the two extra games) was a big factor for the lower percentage and it’s interesting to note that Mason made just one more three-pointer (43) as a junior than he did as a sophomore (42). In fact, Mason either tied or missed tying by one in seven of the 25 statistical categories: Games started (all), minutes per game (33.5), three-point makes (43-42), turnovers (73-74), steals (50) and blocks (3-4).
• Free throw percentage — As was the case with his three-point shooting, a higher volume of free throws led to a lower percentage for Mason, who shot .739 as a junior compared to .786 as a sophomore. That .739 clip came in 44 more free throw attempts and Mason made 26 more free throws in 2015-16 than he did during the 2014-15 season. Again, you have to take into account those two extra games when considering these and all of his numbers, but, even with that included, Mason exceeded what a lot of his numbers should have been based on his career averages.
• Personal fouls — Mason fouled a whopping 19 more times during the 2015-16 season, hacking opponents 84 times compared to just 65 the previous season. When you consider that his minutes per game and starts were the same as the year before, this stat is a pretty good illustration of just how the way officials emphasized the new rules for fouls (especially early in the season) impacted the game.
So what does all of this mean? As with most stats, it really can mean whatever you interpret it to mean. But one thing that cannot be argued is that Mason, injured or not, was at least as productive as a junior as he was during his sophomore season.
In fact, even his points-per-game average was nearly identical — 12.9 ppg as a junior and 12.6 ppg as a sophomore.
A couple of reasons it might not have seemed that way throughout the season? 1. The better season turned in by Wayne Selden, who replaced Mason as the Jayhawks’ second leading scorer behind Perry Ellis. 2. The emergence of sophomore Devonte’ Graham, who played a much bigger role during his second season with the Jayhawks than he did during his first, which often allowed Mason to do more blending in rather than leading the charge.
Either way you viewed it then or view it now, Mason, as any coach would like to see from his point guard, has been remarkably consistent during the past two seasons and has been the steady driving force behind the team’s recent success.
So what should we expect from Mason as a senior in 2016-17? Here’s a wild guess — more of the same.
— Here’s a quick look at the comparison between the two seasons, first in overall stats and second in numbers per 40 minutes. The only stats of the 25 I referenced not shown in the table below are (totals listed in parentheses, with 2015-16 listed first): Games started (38-36), Average minutes (33.5), Average rebounds (4.3-3.9), Assist per game (4.6-3.9) and Average points (12.9-12.6) —
Mason’s past two seasons
| Season | G | MP | FG | FGA | FG% | 3P | 3PA | 3P% | FT | FTA | FT% | ORB | DRB | TRB | AST | STL | BLK | TOV | PF | PTS | |
|---|---|---|---|---|---|---|---|---|---|---|---|---|---|---|---|---|---|---|---|---|---|
| 2014-15 | 36 | 1207 | 150 | 340 | .441 | 42 | 98 | .429 | 110 | 140 | .786 | 22 | 119 | 141 | 142 | 50 | 4 | 74 | 65 | 452 | |
| 2015-16 | 38 | 1272 | 155 | 357 | .434 | 43 | 113 | .381 | 136 | 183 | .743 | 27 | 136 | 163 | 175 | 50 | 3 | 73 | 84 | 489 | |
| Career | 109 | 3044 | 368 | 848 | .434 | 103 | 266 | .387 | 293 | 394 | .744 | 57 | 293 | 350 | 389 | 118 | 8 | 184 | 214 | 1132 |
Mason’s past two seasons per 40 minutes
| Season | MP | FG | FGA | FG% | 3P | 3PA | 3P% | FT | FTA | FT% | TRB | AST | STL | BLK | TOV | PF | PTS |
|---|---|---|---|---|---|---|---|---|---|---|---|---|---|---|---|---|---|
| 2014-15 | 1207 | 5.0 | 11.3 | .441 | 1.4 | 3.2 | .429 | 3.6 | 4.6 | .786 | 4.7 | 4.7 | 1.7 | 0.1 | 2.5 | 2.2 | 15.0 |
| 2015-16 | 1272 | 4.9 | 11.2 | .434 | 1.4 | 3.6 | .381 | 4.3 | 5.8 | .743 | 5.1 | 5.5 | 1.6 | 0.1 | 2.3 | 2.6 | 15.4 |
| Career | 3044 | 4.8 | 11.1 | .434 | 1.4 | 3.5 | .387 | 3.9 | 5.2 | .744 | 4.6 | 5.1 | 1.6 | 0.1 | 2.4 | 2.8 | 14.9 |
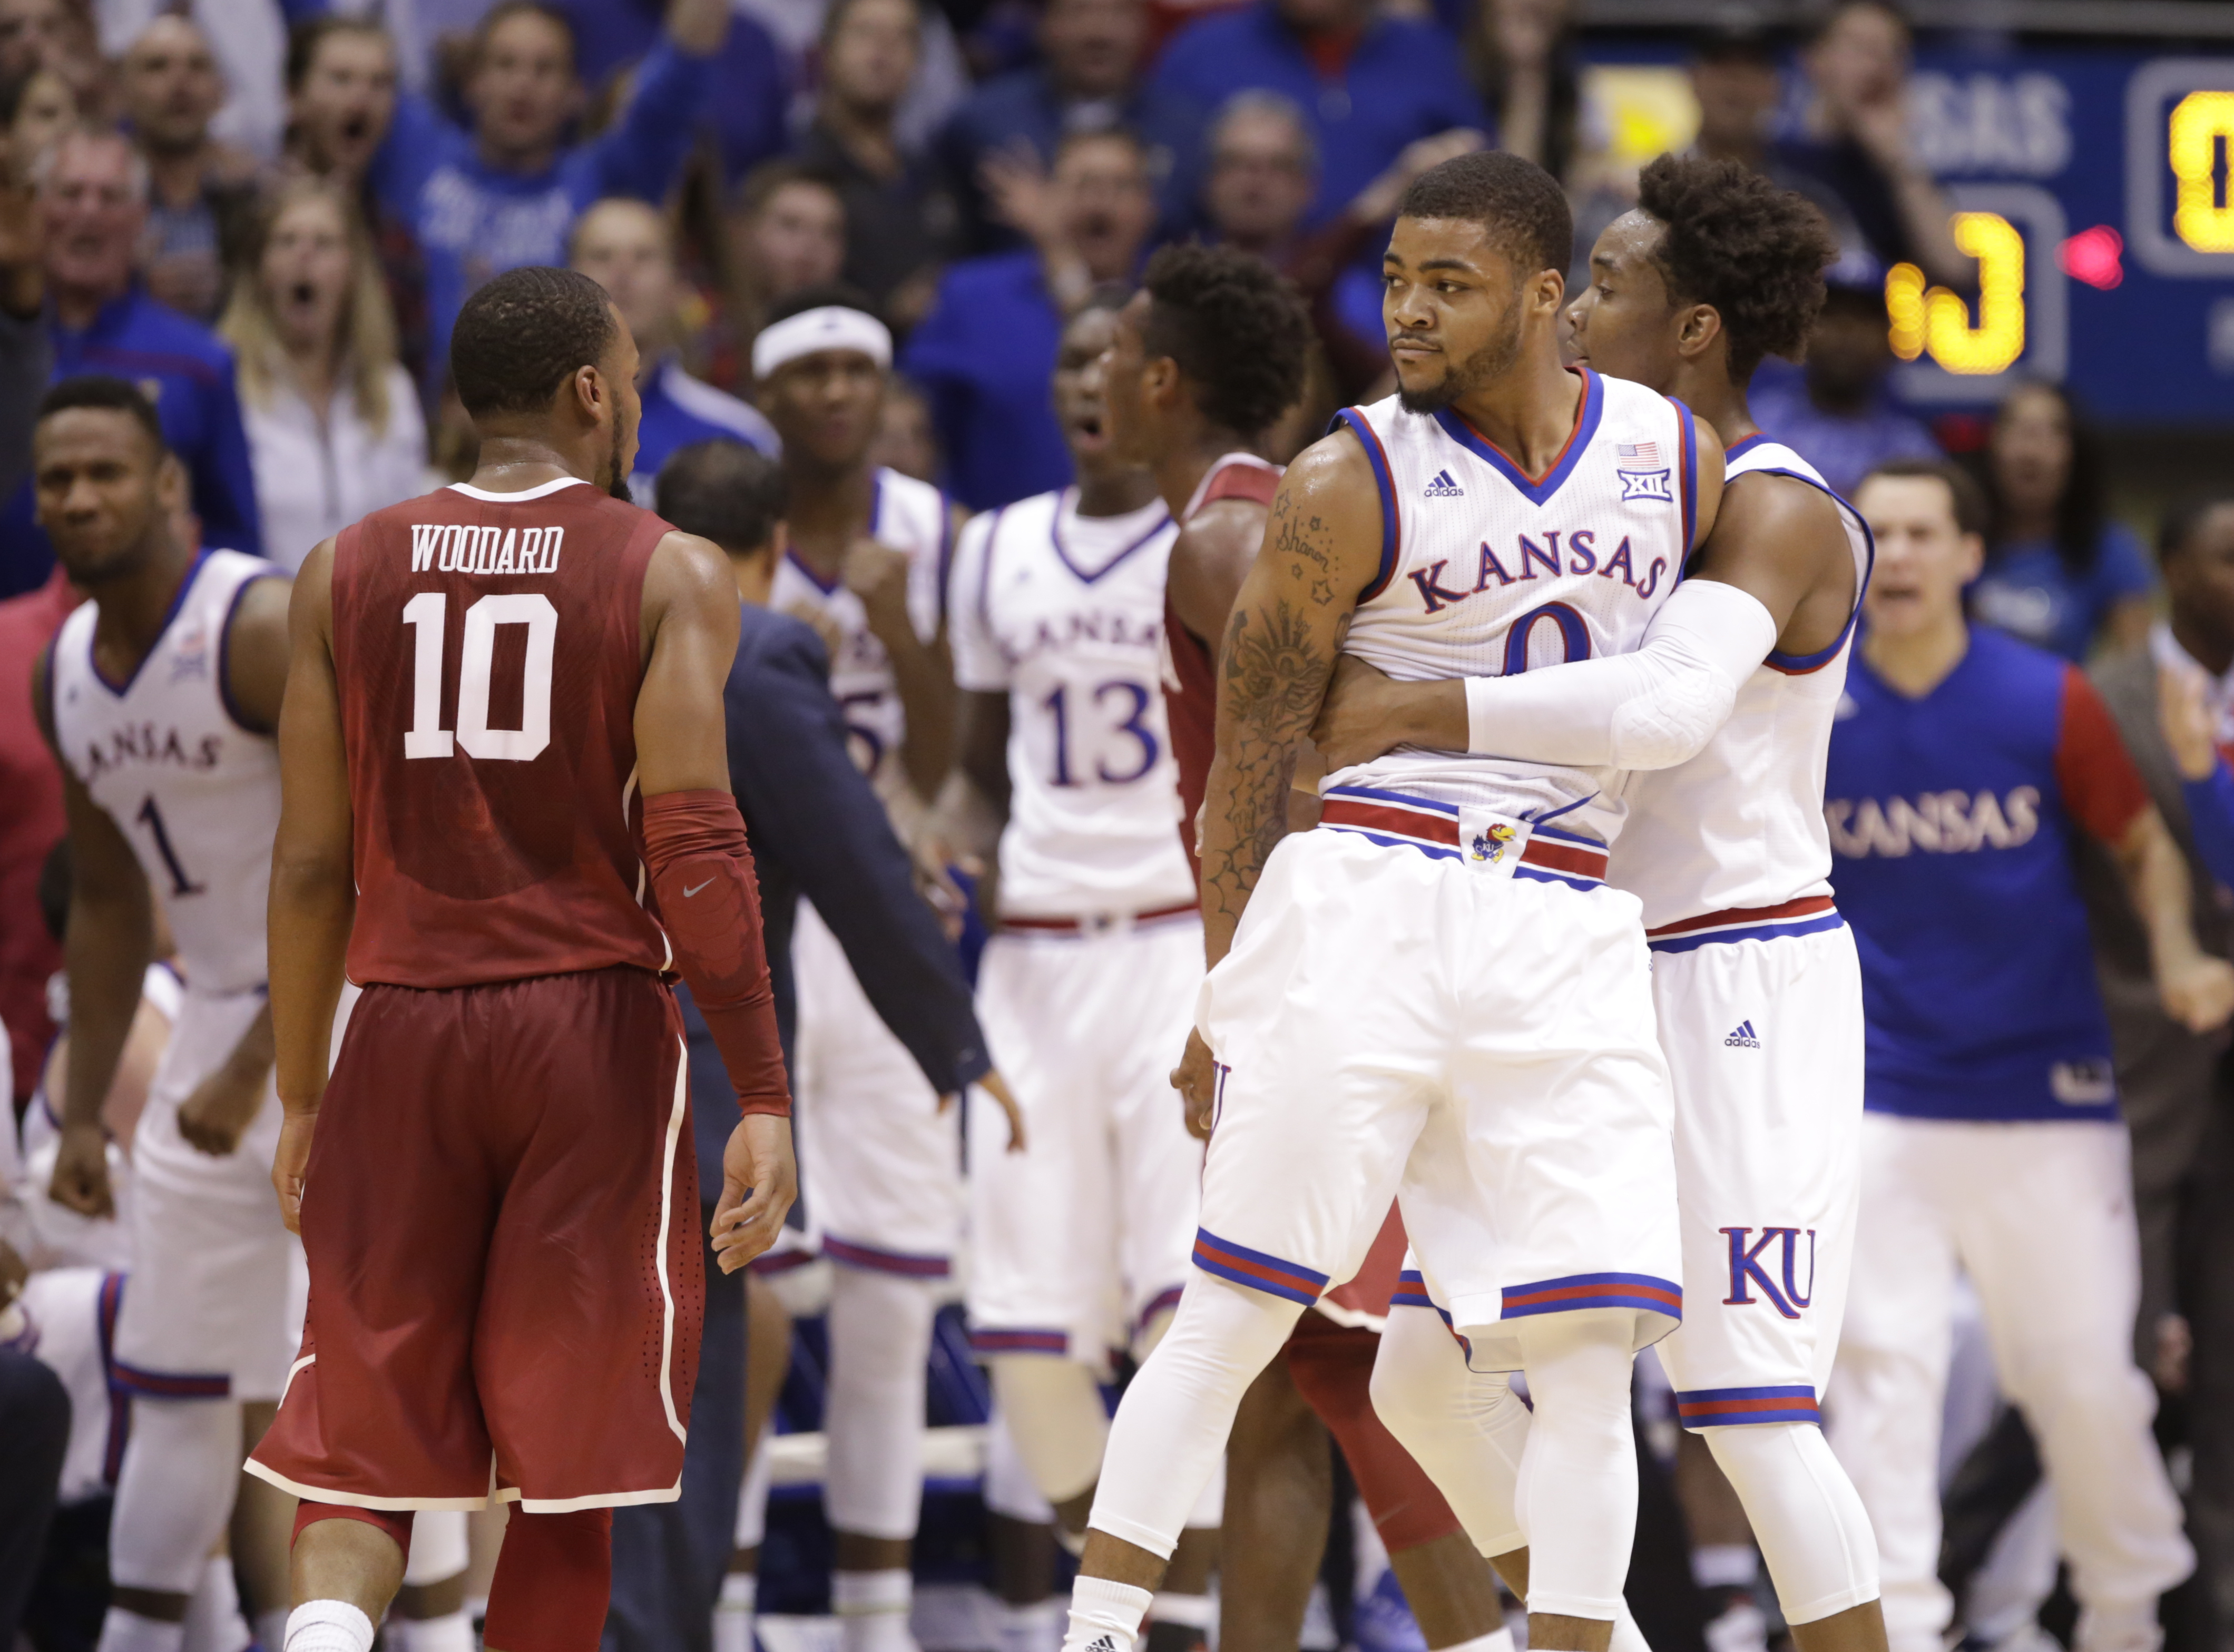
photo by: Nick Krug
Kansas guard Frank Mason III (0) is held back by Kansas guard Devonte' Graham (4) after he was whistled for a foul on Oklahoma guard Buddy Hield (24) with seconds remain during the first half, Monday, Jan. 4, 2016 at Allen Fieldhouse.